Observability Component
Musings: On Observability in Overseer (March 21st, 2026)
This is a weird one. I don't see this as a true replacement for the Logfire UI, but they do give enough useful info to warrant a spot in Overseer. I just have to find the balance.
Distributed tracing, metrics, and log correlation with Pydantic Logfire — auto-instruments your application and adapts to whichever components you have enabled.
Adding Observability to Your Project
What Observability Adds
When you include the observability component, your project gets:
- Pydantic Logfire integration with automatic configuration
- FastAPI instrumentation — traces every request (health/dashboard endpoints excluded)
- HTTPX instrumentation — traces outbound HTTP calls
- SQLAlchemy instrumentation — auto-enabled when the database component is present
- Redis instrumentation — auto-enabled when the redis component is present
- Health check integration with the Overseer dashboard, including Logfire Query API analytics
- Dashboard card + detail modal with trace metrics, slowest spans, and exception tracking
- Graceful degradation — works without a cloud token (local instrumentation only)
Generated Files
my-project/
├── app/
│   └── components/
│       ├── backend/
│       │   └── middleware/
│       │       └── logfire_tracing.py    # Auto-discovered Logfire middleware
│       └── frontend/
│           └── dashboard/
│               ├── cards/
│               │   └── observability_card.py   # Overseer dashboard card
│               └── modals/
│                   └── observability_modal.py  # Detail modal with tabs
└── .env.example                          # Updated with Logfire variables
How It Works
graph TB
    subgraph "Application Startup"
        Hooks[Backend Hooks<br/>Auto-discovery]
        MW[logfire_tracing.py<br/>register_middleware]
    end

    subgraph "Instrumentation"
        FA[FastAPI<br/>Request tracing]
        HX[HTTPX<br/>Outbound HTTP]
        SA[SQLAlchemy<br/>Database queries]
        RD[Redis<br/>Cache operations]
    end

    subgraph "Logfire Cloud"
        Cloud[Logfire Dashboard<br/>Traces + Metrics]
        QA[Query API<br/>Analytics]
    end

    subgraph "Overseer Dashboard"
        Card[Observability Card<br/>Status + Metrics]
        Modal[Detail Modal<br/>Spans + Exceptions]
    end

    Hooks -->|discovers| MW
    MW --> FA
    MW --> HX
    MW -.->|if database| SA
    MW -.->|if redis| RD

    FA -->|LOGFIRE_TOKEN| Cloud
    HX -->|LOGFIRE_TOKEN| Cloud
    SA -->|LOGFIRE_TOKEN| Cloud
    RD -->|LOGFIRE_TOKEN| Cloud

    QA -->|LOGFIRE_READ_TOKEN| Card
    QA -->|LOGFIRE_READ_TOKEN| Modal

    style Hooks fill:#e1f5fe
    style MW fill:#e1f5fe
    style FA fill:#e8f5e8
    style HX fill:#e8f5e8
    style SA fill:#f3e5f5
    style RD fill:#f3e5f5
    style Cloud fill:#fff3e0
    style QA fill:#fff3e0
    style Card fill:#e8f5e8
    style Modal fill:#e8f5e8
The middleware is auto-discovered by the backend hook system — no manual registration needed. On startup it configures Logfire with your project name and environment, then instruments each available integration.
When LOGFIRE_TOKEN is set, traces are sent to Logfire cloud. Without a token, instrumentation still runs locally (useful for development and structured logging).
Environment Variables
| Variable | Default | Description |
|---|---|---|
LOGFIRE_TOKEN |
- | Enables sending traces to Logfire cloud |
LOGFIRE_READ_TOKEN |
- | Enables Query API analytics in the Overseer dashboard |
LOGFIRE_PROJECT_URL |
- | Link to your Logfire project dashboard |
Set these in your .env file:
# Observability (Logfire)
LOGFIRE_TOKEN=your-write-token
LOGFIRE_READ_TOKEN=your-read-token
LOGFIRE_PROJECT_URL=https://logfire.pydantic.dev/myorg/myproject
Component Integrations
Observability automatically adapts its instrumentation based on which components are enabled in your project:
| Component | Integration | What Gets Traced |
|---|---|---|
| Backend (always) | logfire.instrument_fastapi() |
All HTTP requests (excludes /health/* and /dashboard/*) |
| HTTPX (always) | logfire.instrument_httpx() |
All outbound HTTP calls |
| Database | logfire.instrument_sqlalchemy() |
SQL queries via the shared engine |
| Redis | logfire.instrument_redis() |
Redis commands and pub/sub |
This is handled at template generation time — the logfire[fastapi,httpx] dependency automatically includes extras like sqlalchemy and redis when those components are present.
Overseer Integration
The observability component integrates with the Overseer dashboard through a status card and a detail modal.
Dashboard Card
The card displays real-time Logfire status:
- With Query API (
LOGFIRE_READ_TOKENset): Shows trace count, exception count, average latency, and max latency for the last hour - Without Query API: Shows cloud connection status with a hint to add the read token
Detail Modal
Clicking the card opens a detail modal with four tabs:
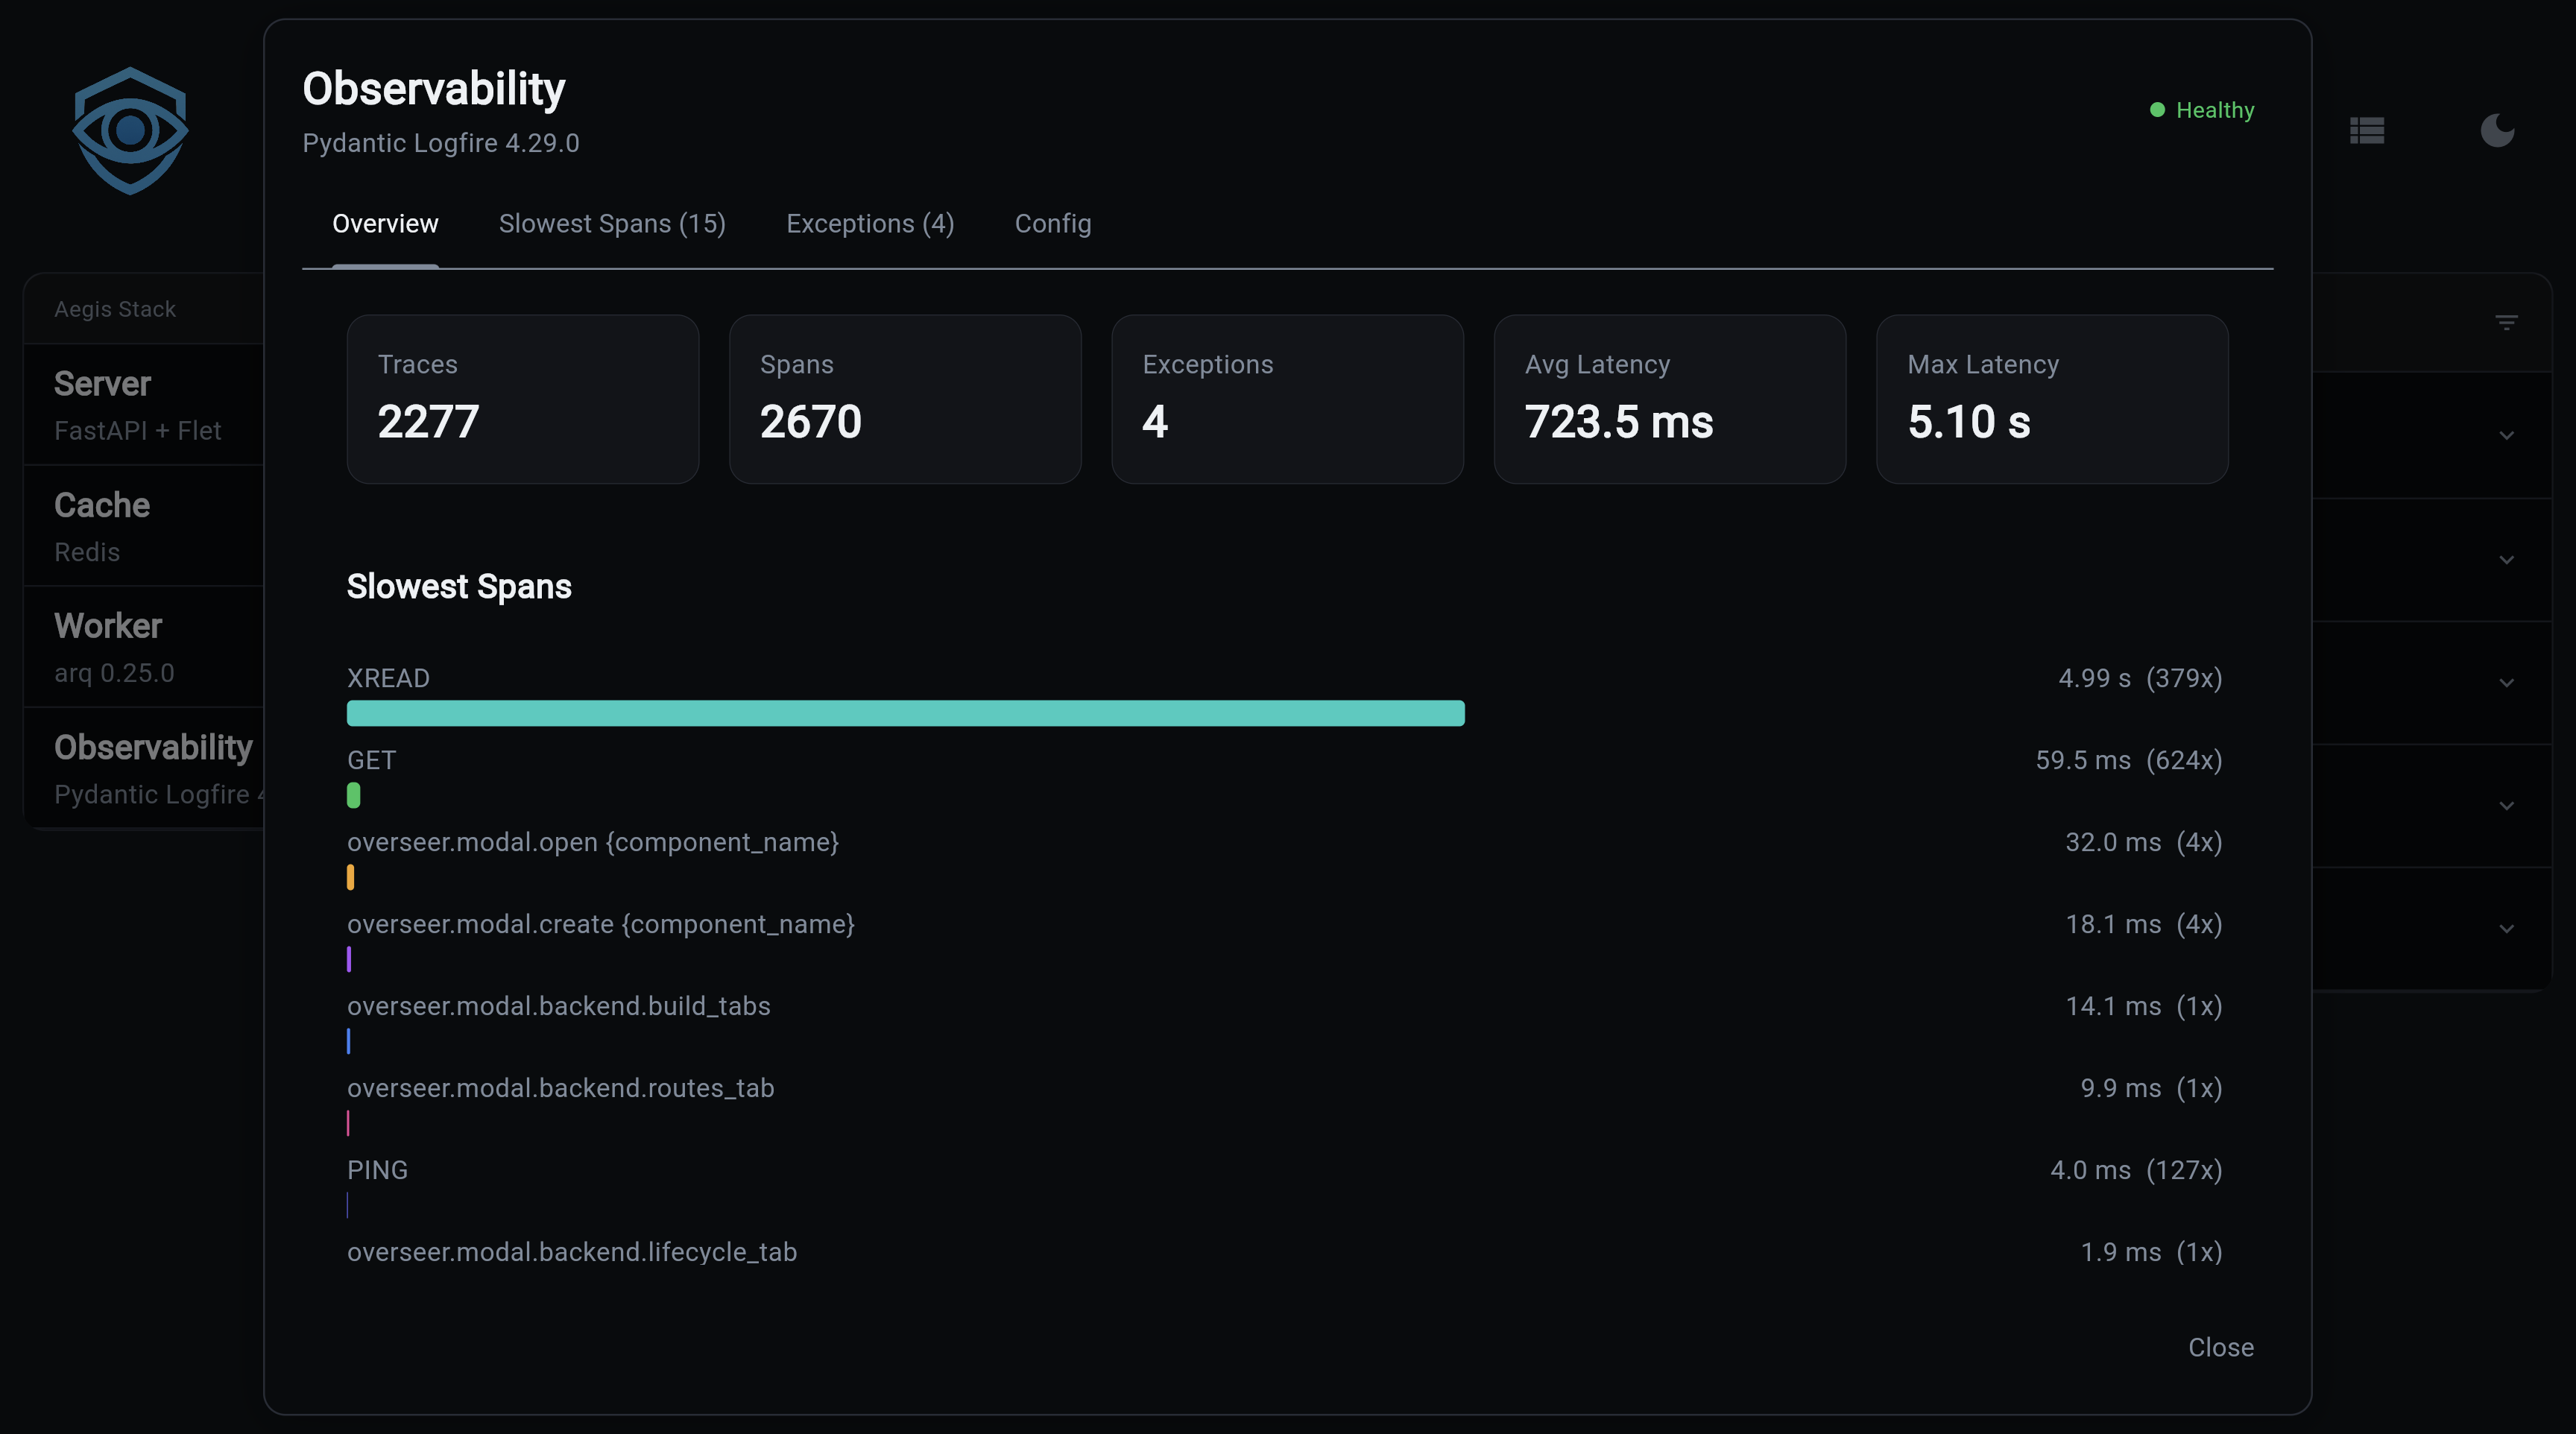
Overview — Key metrics (traces, spans, exceptions, latency) plus a bar chart of the slowest spans:
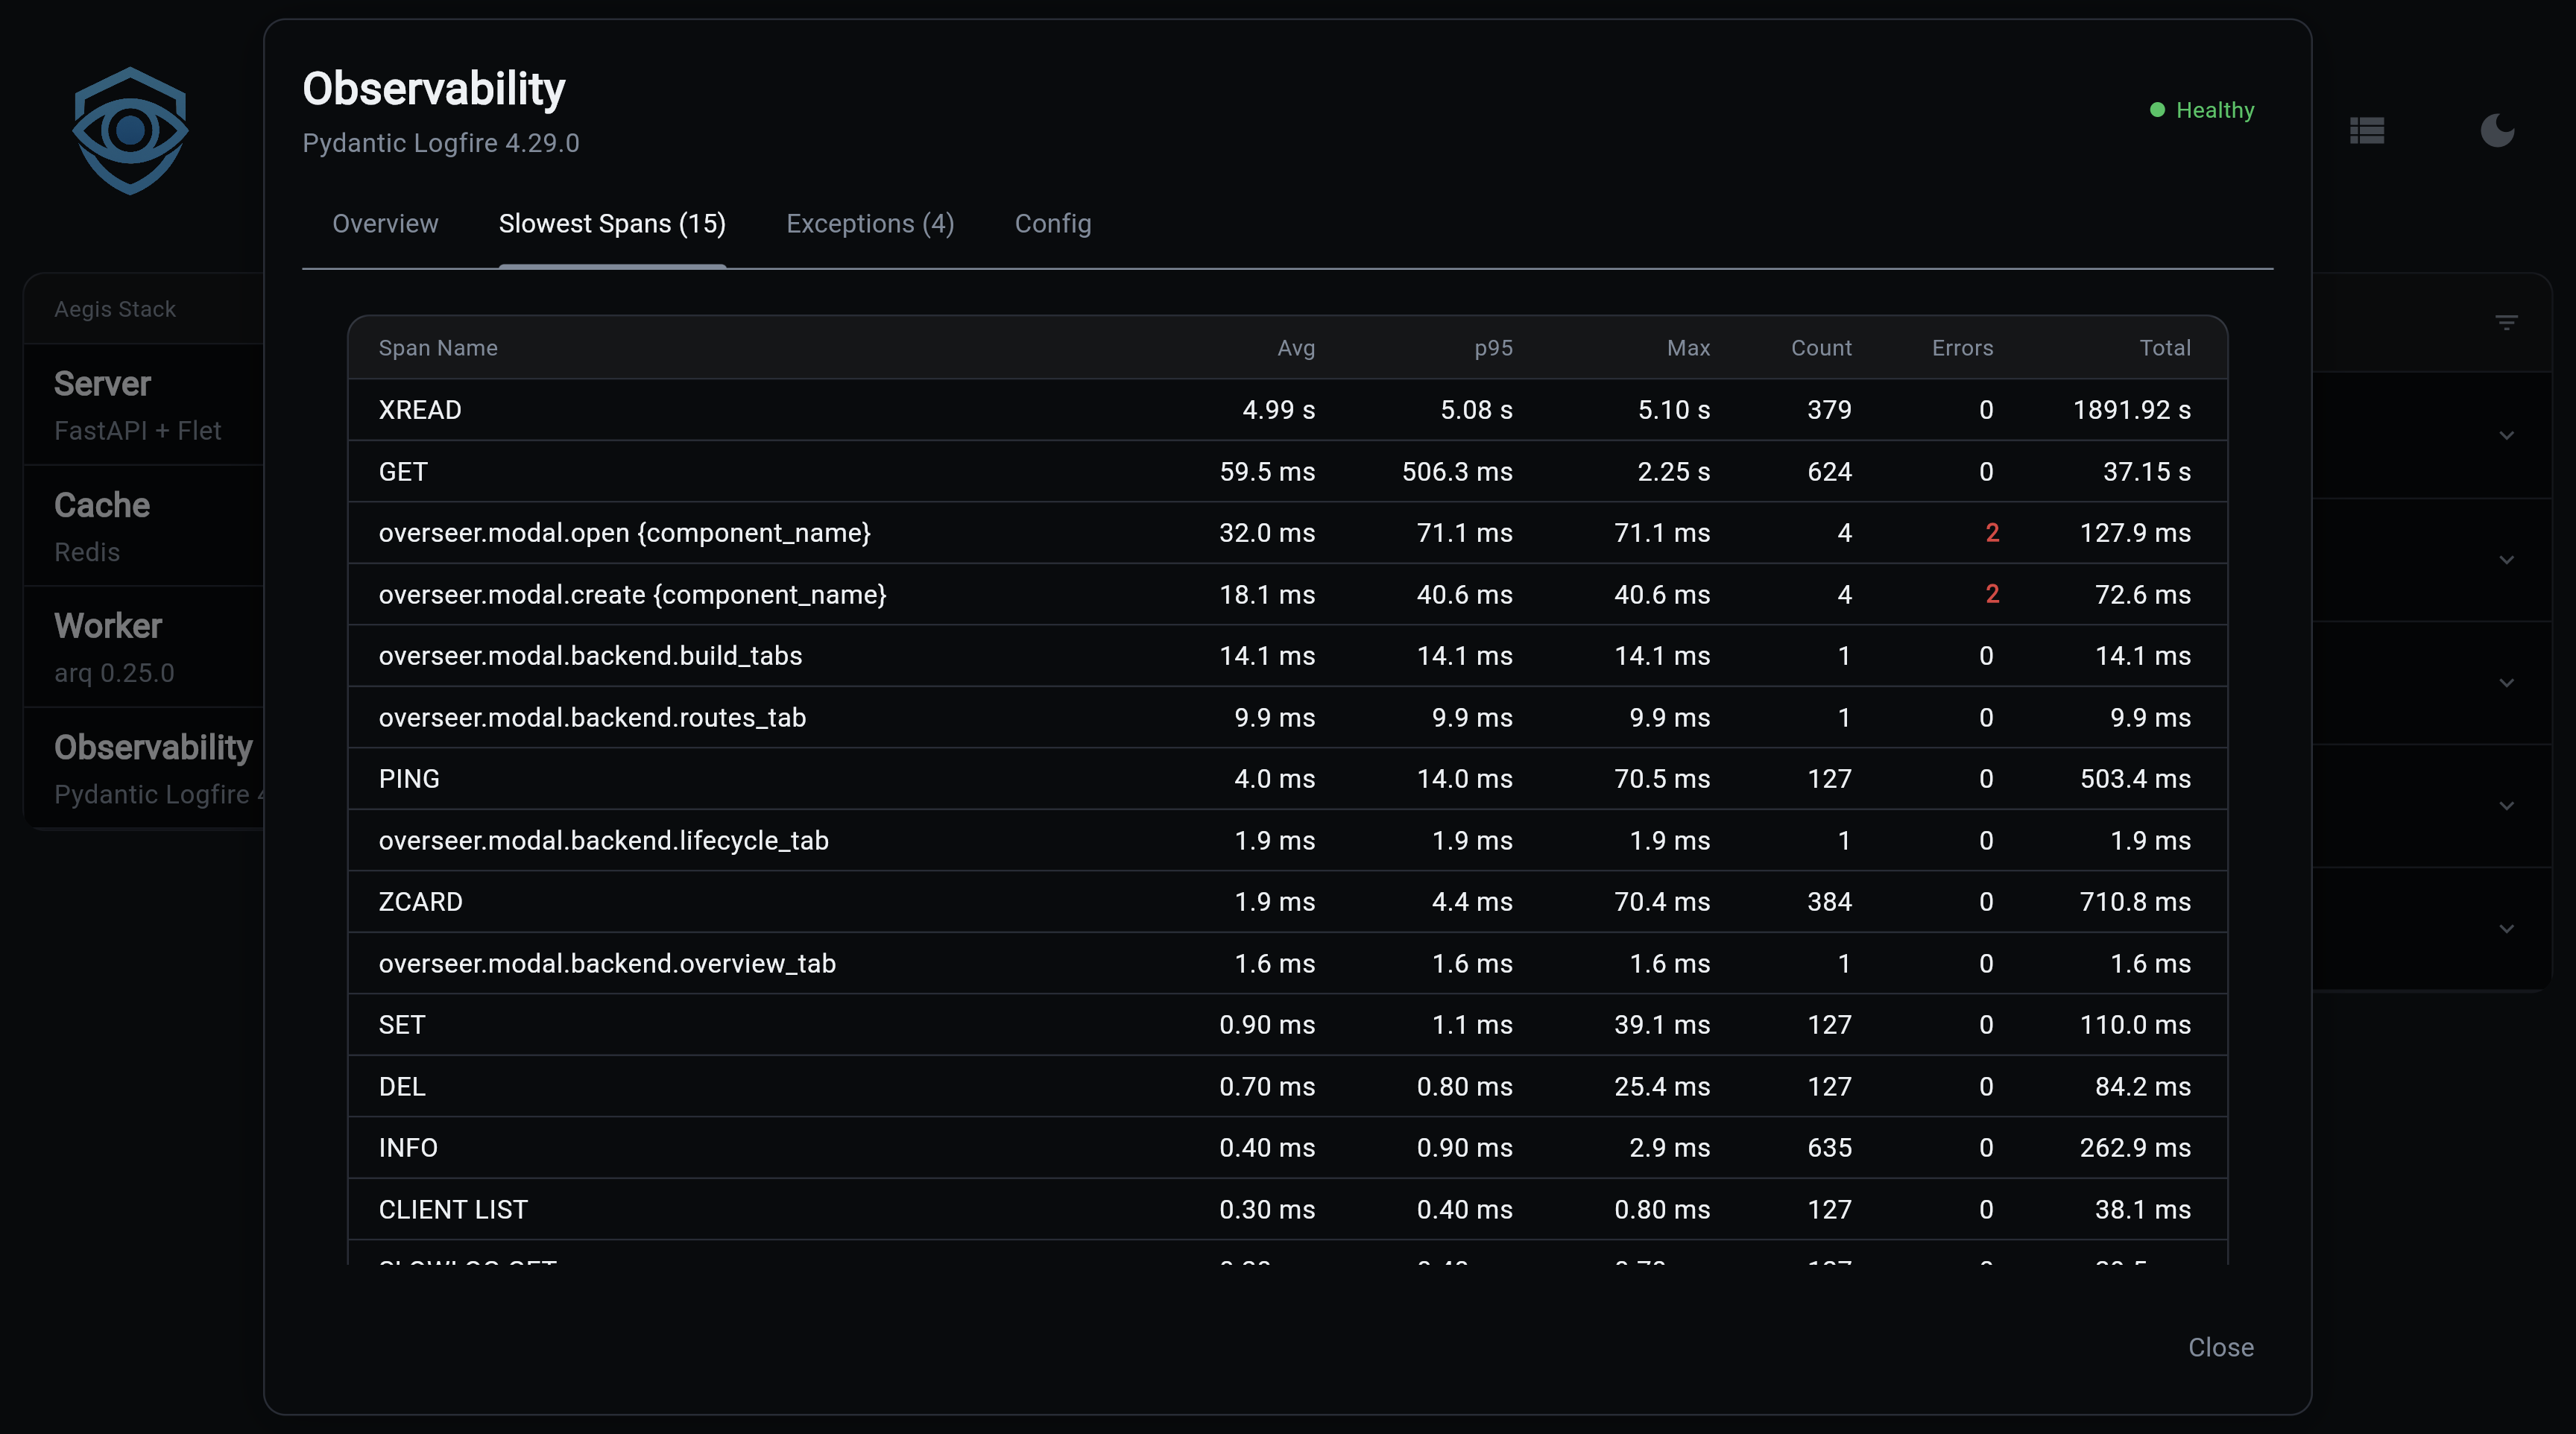
Slowest Spans — Full table with avg, p95, and max latency per span type, with error counts highlighted in red:
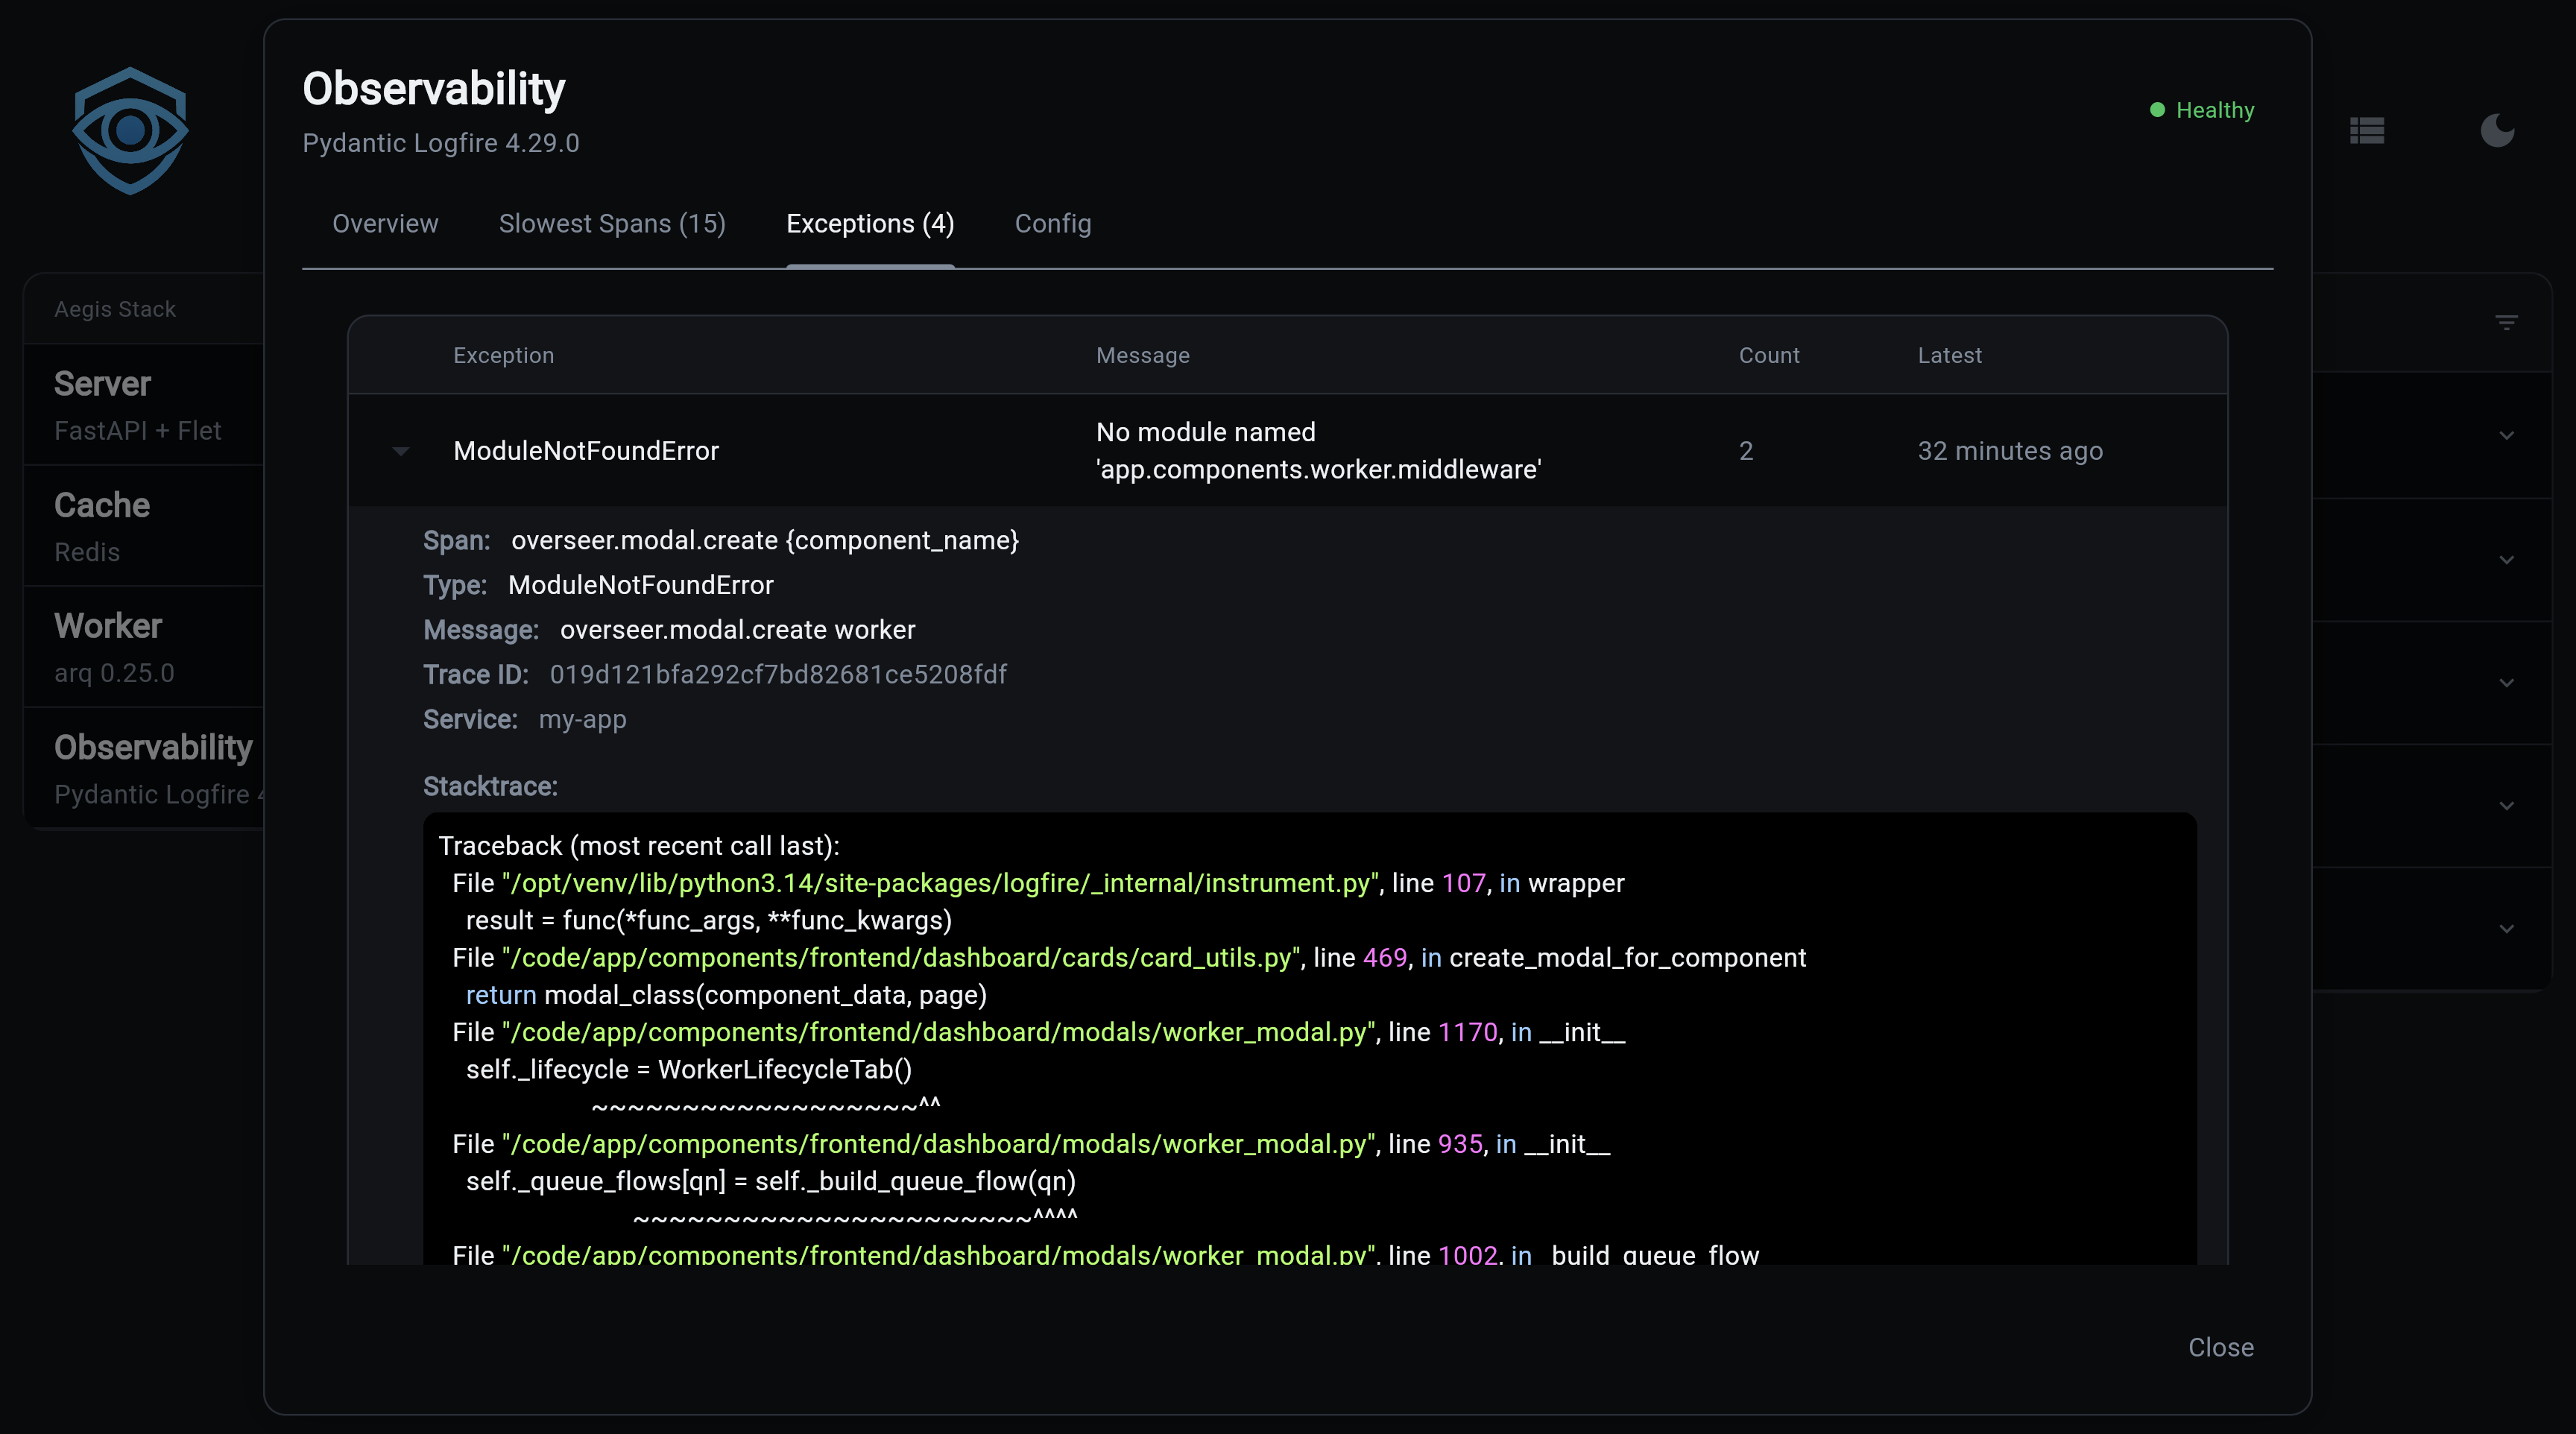
Exceptions — Expandable table of exceptions from the last 24 hours, grouped by type. Click to expand and see the full stack trace.
Config — Service name, cloud status, Query API availability, and project URL link
Health Check
The health check queries the Logfire Query API (when LOGFIRE_READ_TOKEN is set) and reports:
- Total spans and traces (last hour)
- Exception count
- Average and max latency
- Top 20 slowest spans
- Recent exceptions (last 24 hours)
Results are cached for 2 minutes with a 5-minute backoff on failure to respect rate limits.
Next Steps
- Component Overview — Understanding Aegis Stack's component architecture
- Integration Patterns — How components work together
- Pydantic Logfire Documentation — Complete Logfire reference