Insights Service
The Insights Service automates tracking of your project's adoption metrics across GitHub, PyPI, Plausible Analytics, and Reddit. It collects, stores, and visualizes the data that matters for understanding how your project is growing.
Experimental Service
Insights is currently experimental. The data model, collectors, and dashboard are functional but the API surface may change in future releases.
Quick Start
aegis init my-app --services "insights[github,pypi]" --components database,scheduler
cd my-app
uv sync && source .venv/bin/activate
Configure your .env with API keys, then collect:
Why Track Adoption Metrics?
If you ship open source software, the numbers you see on GitHub and PyPI are misleading without context. GitHub Traffic expires after 14 days. PyPI download counts are 97% bots. Stars don't tell you who's actually using your tool.
Insights solves this by:
- Preserving data that would otherwise expire (GitHub's 14-day rolling window)
- Separating signal from noise (human downloads vs bot mirrors on PyPI)
- Correlating events across sources (did that Reddit post drive stars? did the release drive clones?)
- Tracking records automatically (new all-time highs are detected and logged)
- Visualizing everything in the Overseer dashboard with interactive charts
What You Get
- 6 data source collectors - GitHub Traffic, Stars, Events, PyPI Downloads, Plausible Analytics, Reddit Posts
- Human vs bot classification - 97% of PyPI downloads are automated mirrors. Insights separates signal from noise.
- Event correlation - Releases, stars, Reddit posts, and milestones annotated on every chart
- Automatic record detection - New all-time highs are logged as milestone events
- Interactive Overseer dashboard - 7 tabs with date range filtering and period-over-period comparison
- CLI and scheduler - Collect on-demand or automate at configurable intervals
Architecture
graph TB
    subgraph "Data Sources"
        GH_API[GitHub Traffic API<br/>Clones, Views, Referrers]
        GH_STARS[GitHub Stargazers API<br/>Star profiles]
        CH[ClickHouse Public SQL<br/>PyPI downloads, GitHub events]
        PL[Plausible API<br/>Doc site visitors]
        RD[Reddit JSON API<br/>Post stats]
    end

    subgraph "Insights Service"
        Collectors[Collectors<br/>One per source]
        DB[(insight_metric<br/>insight_event<br/>insight_source)]
        Records[Record Detector<br/>Auto-milestone creation]
    end

    subgraph "Presentation"
        CLI[CLI Commands<br/>collect, status, stars]
        Dashboard[Overseer Dashboard<br/>7 interactive tabs]
    end

    GH_API --> Collectors
    GH_STARS --> Collectors
    CH --> Collectors
    PL --> Collectors
    RD --> Collectors
    Collectors --> DB
    Collectors --> Records
    Records --> DB
    DB --> CLI
    DB --> Dashboard
Data Flow
sequenceDiagram
    participant S as Scheduler
    participant C as Collector
    participant API as External API
    participant DB as Database
    participant R as Record Detector
    participant UI as Overseer

    S->>C: Trigger collection (hourly/daily)
    C->>API: Fetch data
    API-->>C: Raw metrics
    C->>DB: Upsert daily rows
    C->>R: Check for new records
    R->>DB: Compare against milestones
    R-->>DB: Create event if ATH broken
    UI->>DB: Query on modal open
    DB-->>UI: Metrics + events
Bracket Syntax
Insights uses bracket syntax to select which data sources to enable:
# GitHub + PyPI (default)
aegis init my-app --services insights

# All sources
aegis init my-app --services "insights[github,pypi,plausible,reddit]"

# Just GitHub
aegis init my-app --services "insights[github]"
Available sources: github, pypi, plausible, reddit
Quick Start
-
Create a project with Insights
-
Configure API keys in
.env -
Run initial collection
-
Backfill historical data (PyPI goes back 365 days, Plausible too)
-
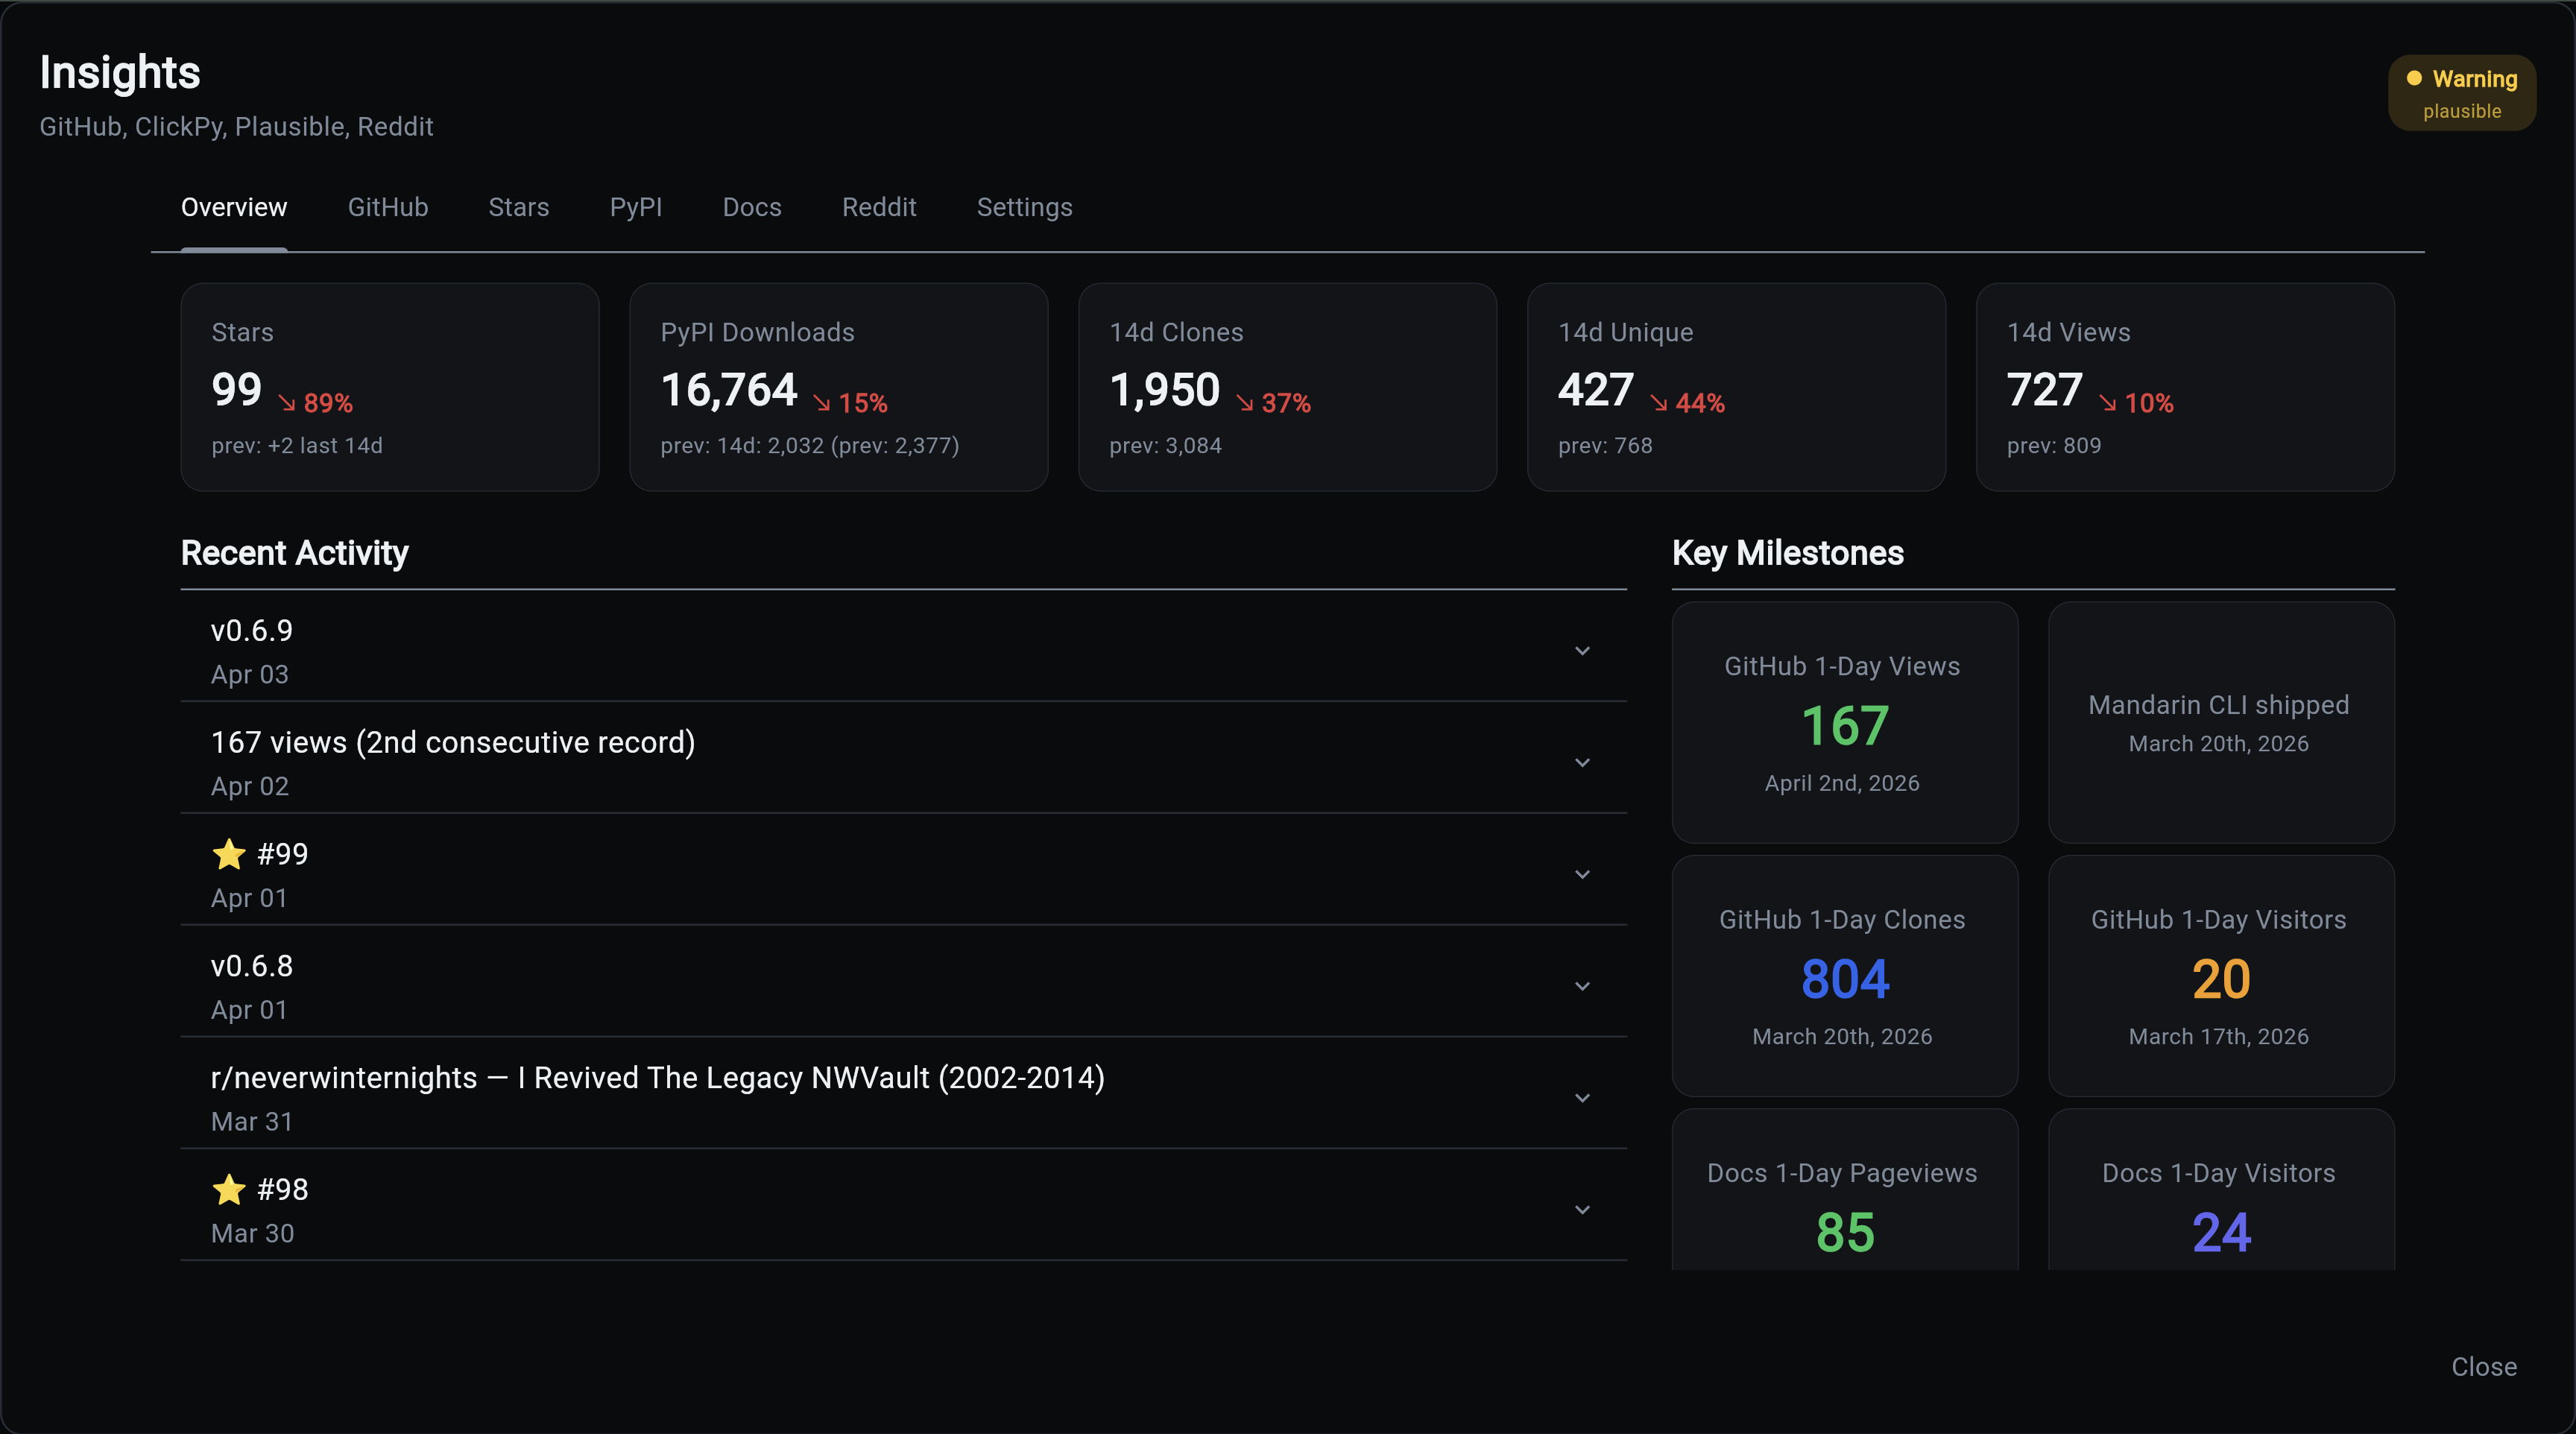
Open the Overseer dashboard and click the Insights card to see your data.
Required Components
| Component | Required | Why |
|---|---|---|
| Database | Yes | Stores all metrics, events, and source configuration |
| Scheduler | Yes | Automates collection at configured intervals |
| Backend | Yes | API endpoints for dashboard data |
| Frontend | Recommended | Overseer dashboard visualization |
Next Steps
| Topic | Description |
|---|---|
| Data Sources | What each source collects and how |
| CLI Commands | Command reference for collection and management |
| Dashboard | Overseer modal tabs and interactive features |
| Configuration | Environment variables and collection intervals |
| Examples | Real-world patterns and analysis workflows |