Cost Tracking & Usage Analytics
Every AI request is automatically tracked — tokens consumed, cost calculated, and success or failure recorded. No instrumentation required. The data is available immediately via API and visualized in the frontend analytics dashboard.
Requires Database Backend
Cost tracking is only active when the AI service is configured with a database backend:
With the default in-memory backend, the /ai/usage/stats endpoint is not available and usage is not persisted.
What You Get
- Automatic tracking - every
chatandstream_chatcall records tokens and cost - Catalog-based pricing - costs calculated from the LLM Catalog's versioned price entries
- Per-user breakdown - filter usage by
user_idto see individual consumption - Model breakdown - compare spend and volume across models and providers
- Real-time dashboard - frontend analytics tab with hero stats, pie chart, and activity table
- Illiana context - usage stats injected into Illiana's system prompt so she can answer cost questions
How It Works
Every call to chat() or stream_chat() follows this flow:
Request
  │
  ├─ AI provider call (OpenAI, Groq, Anthropic, etc.)
  │
  ├─ Extract token counts from response
  │     PydanticAI: result.usage.request_tokens / response_tokens
  │     LangChain:  response_metadata['token_usage']
  │
  ├─ Look up model price from LLM Catalog
  │     SELECT ... ORDER BY effective_date DESC LIMIT 1
  │
  ├─ Calculate cost
  │     (input_tokens × input_cost) + (output_tokens × output_cost)
  │
  └─ Write LLMUsage record to database
        Non-blocking: a failure here never fails the request
Key Behaviors
- Vendor prefix stripping -
openai/gpt-4ois recorded asgpt-4ofor consistency - Unknown models - If a model isn't in the catalog, usage is still recorded with
total_cost = 0.0 - Non-blocking - If the database write fails, the error is logged but the AI response returns normally
API Endpoint
GET /ai/usage/stats
Returns aggregated usage statistics.
Query Parameters:
| Parameter | Type | Required | Default | Description |
|---|---|---|---|---|
user_id |
string | No | all users | Filter to a specific user |
start_time |
datetime | No | all time | ISO 8601 lower bound |
end_time |
datetime | No | now | ISO 8601 upper bound |
recent_limit |
integer | No | 10 | Number of recent activity records |
All aggregations are performed at the SQL level (GROUP BY, SUM, COUNT, AVG).
Response:
{
  "total_tokens": 45230,
  "input_tokens": 32100,
  "output_tokens": 13130,
  "total_cost": 0.47,
  "total_requests": 23,
  "success_rate": 95.6,
  "models": [
    {
      "model_id": "gpt-4o",
      "vendor": "OpenAI",
      "requests": 15,
      "tokens": 30000,
      "cost": 0.35,
      "percentage": 65.2
    }
  ],
  "recent_activity": [
    {
      "timestamp": "2024-01-15T10:30:00Z",
      "model": "gpt-4o",
      "input_tokens": 1500,
      "output_tokens": 800,
      "cost": 0.02,
      "success": true,
      "action": "chat"
    }
  ]
}
Examples:
# All-time totals
curl http://localhost:8000/ai/usage/stats | jq

# Filter by user
curl "http://localhost:8000/ai/usage/stats?user_id=alice" | jq

# Last 7 days
curl "http://localhost:8000/ai/usage/stats?start_time=2024-01-08T00:00:00Z" | jq

# Show last 25 requests
curl "http://localhost:8000/ai/usage/stats?recent_limit=25" | jq
import httpx
from datetime import datetime, timedelta, timezone

# All-time stats
response = httpx.get("http://localhost:8000/ai/usage/stats")
stats = response.json()
print(f"Total cost: ${stats['total_cost']:.4f}")
print(f"Total requests: {stats['total_requests']}")
print(f"Success rate: {stats['success_rate']:.1f}%")

# Per-model breakdown
for model in stats["models"]:
    print(f"  {model['model_id']}: {model['requests']} reqs, "
          f"${model['cost']:.4f} ({model['percentage']:.1f}%)")

# Filter to last 24 hours for a specific user
now = datetime.now(timezone.utc)
yesterday = now - timedelta(days=1)

response = httpx.get(
    "http://localhost:8000/ai/usage/stats",
    params={
        "user_id": "alice",
        "start_time": yesterday.isoformat(),
    },
)
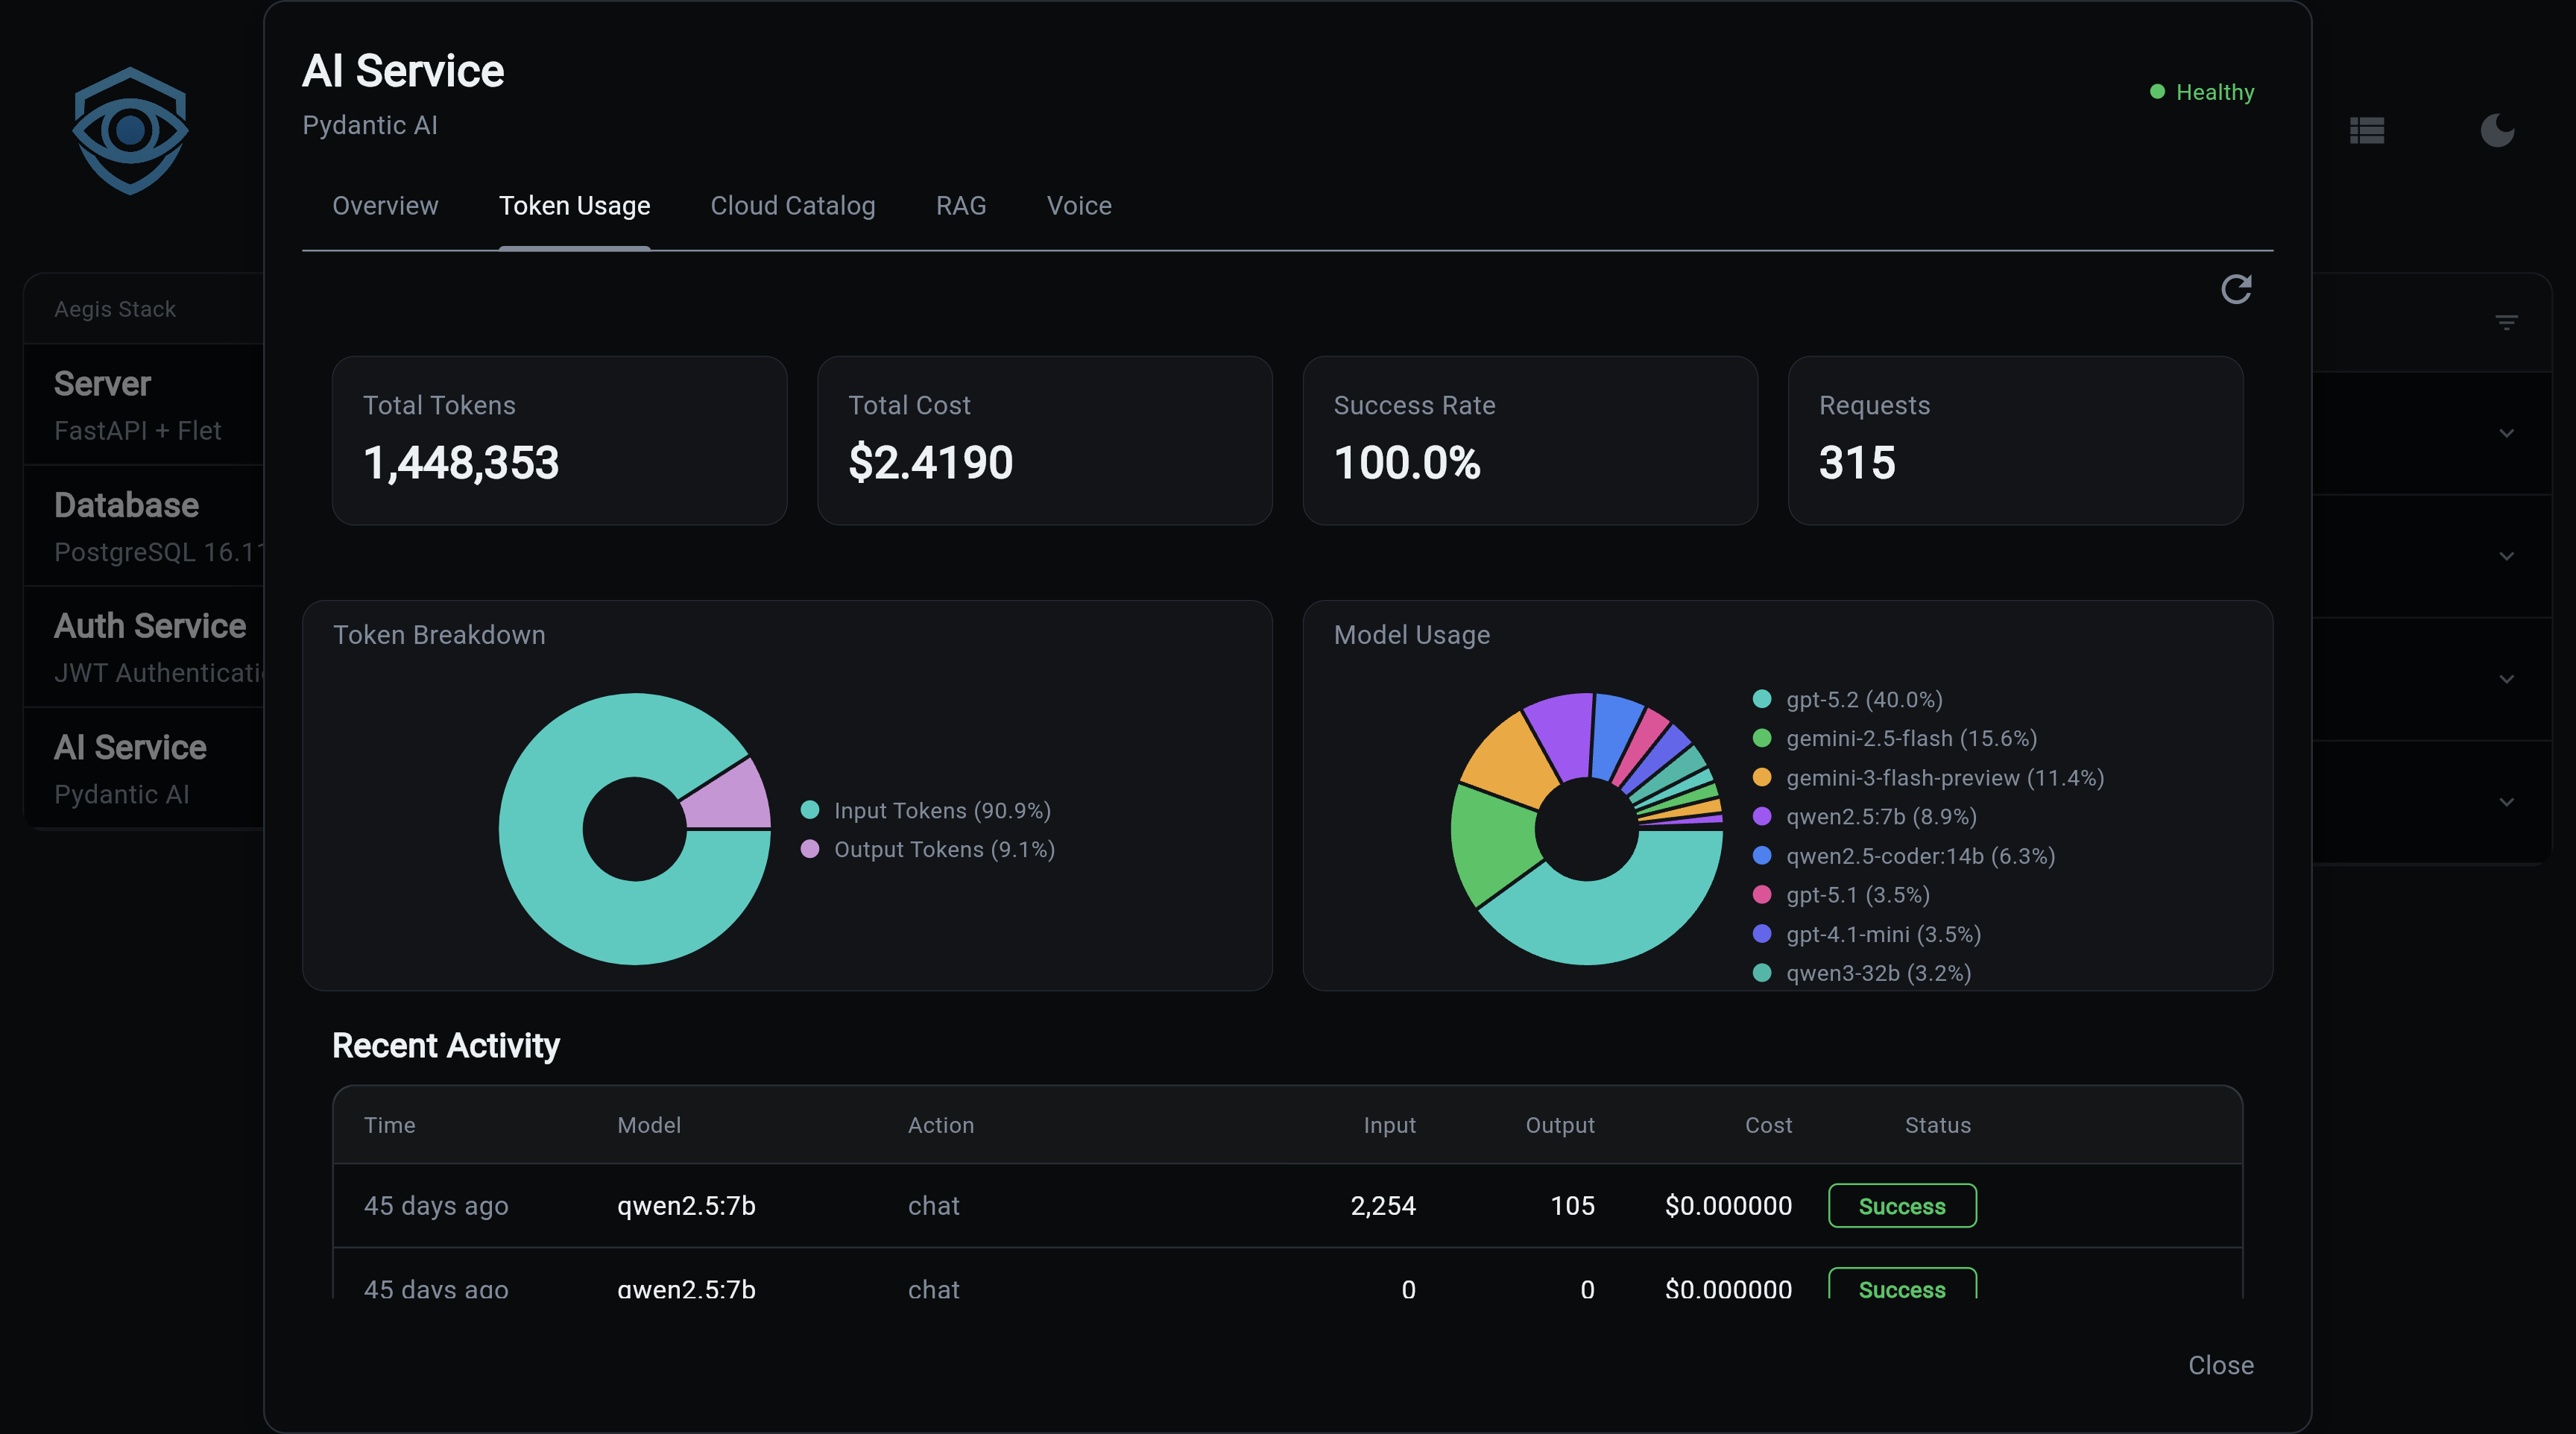
Analytics Dashboard
The frontend includes an analytics tab (ai_analytics_tab.py) with real-time usage visualization.
Hero stats cards:
| Card | Description |
|---|---|
| Total Tokens | Sum of all input + output tokens |
| Total Cost | Cumulative spend across all models |
| Success Rate | Percentage of requests completed without error |
| Total Requests | Count of all tracked AI calls |
Model usage pie chart - visual breakdown of request volume per model.
Recent activity table - last N requests with timestamp, model, token counts, cost, success flag, and action type.
Cost Calculation
Location: app/services/ai/service.py
# Simplified - actual implementation in service.py
async def calculate_cost(input_tokens: int, output_tokens: int) -> float:
    # Look up current model in catalog
    price = get_latest_price(model_id)  # ORDER BY effective_date DESC LIMIT 1
    if not price:
        return 0.0
    return (input_tokens * price.input_cost_per_token) + \
           (output_tokens * price.output_cost_per_token)
Price Versioning
LLMPrice rows include an effective_date. When a provider updates pricing, a new row is added rather than overwriting the old one. Historical records retain the cost that was accurate when written; only new requests pick up the new price.
LLMPrice rows for gpt-4o:
  effective_date=2024-01-01  input=$2.50/1M  output=$10.00/1M
  effective_date=2024-05-01  input=$2.50/1M  output=$10.00/1M  ← current
LLMPrice also supports a cache_input_cost_per_token field for providers that offer prompt caching.
Database Model
Table: llm_usage
Location: app/services/ai/models/llm/llm_usage.py
| Column | Type | Notes |
|---|---|---|
model_id |
string, indexed | Without vendor prefix (gpt-4o, not openai/gpt-4o) |
user_id |
string, indexed, nullable | Null for unauthenticated requests |
timestamp |
datetime, indexed | Auto-set to UTC |
input_tokens |
integer | >= 0 |
output_tokens |
integer | >= 0 |
total_cost |
float | Calculated at record time from catalog prices |
success |
boolean | Default True; False on provider errors |
error_message |
string, nullable | Populated on failure |
action |
string, indexed | "chat" or "stream_chat" |
A compound index on (timestamp, model_id) keeps time-range + model aggregation queries fast.
Decoupled from Foreign Key
model_id is a plain string, not a foreign key to the LLM Catalog. Usage records survive catalog resets, model renames, and schema migrations without orphaned rows.
Illiana Context
Usage statistics are automatically included in Illiana's system prompt via UsageContext (app/services/ai/usage_context.py).
This means Illiana can answer questions like:
- "How much have I spent this month?"
- "Which model am I using most?"
- "What's my success rate?"
format_for_prompt(compact=True) produces a condensed version for smaller models (Ollama), keeping the system prompt short.
Ollama Zero-Cost
Illiana knows that Ollama models report $0.00 cost by design — local inference has no per-token billing. She won't flag zero cost as an anomaly.
Next Steps:
- LLM Catalog - Model registry with pricing data
- AI Service Overview - Getting started
- API Reference - All REST endpoints
- CLI Commands - Command-line interface