Overseer Dashboard
The Insights service integrates with the Overseer dashboard as an interactive modal with 7 tabs.
Overview Tab
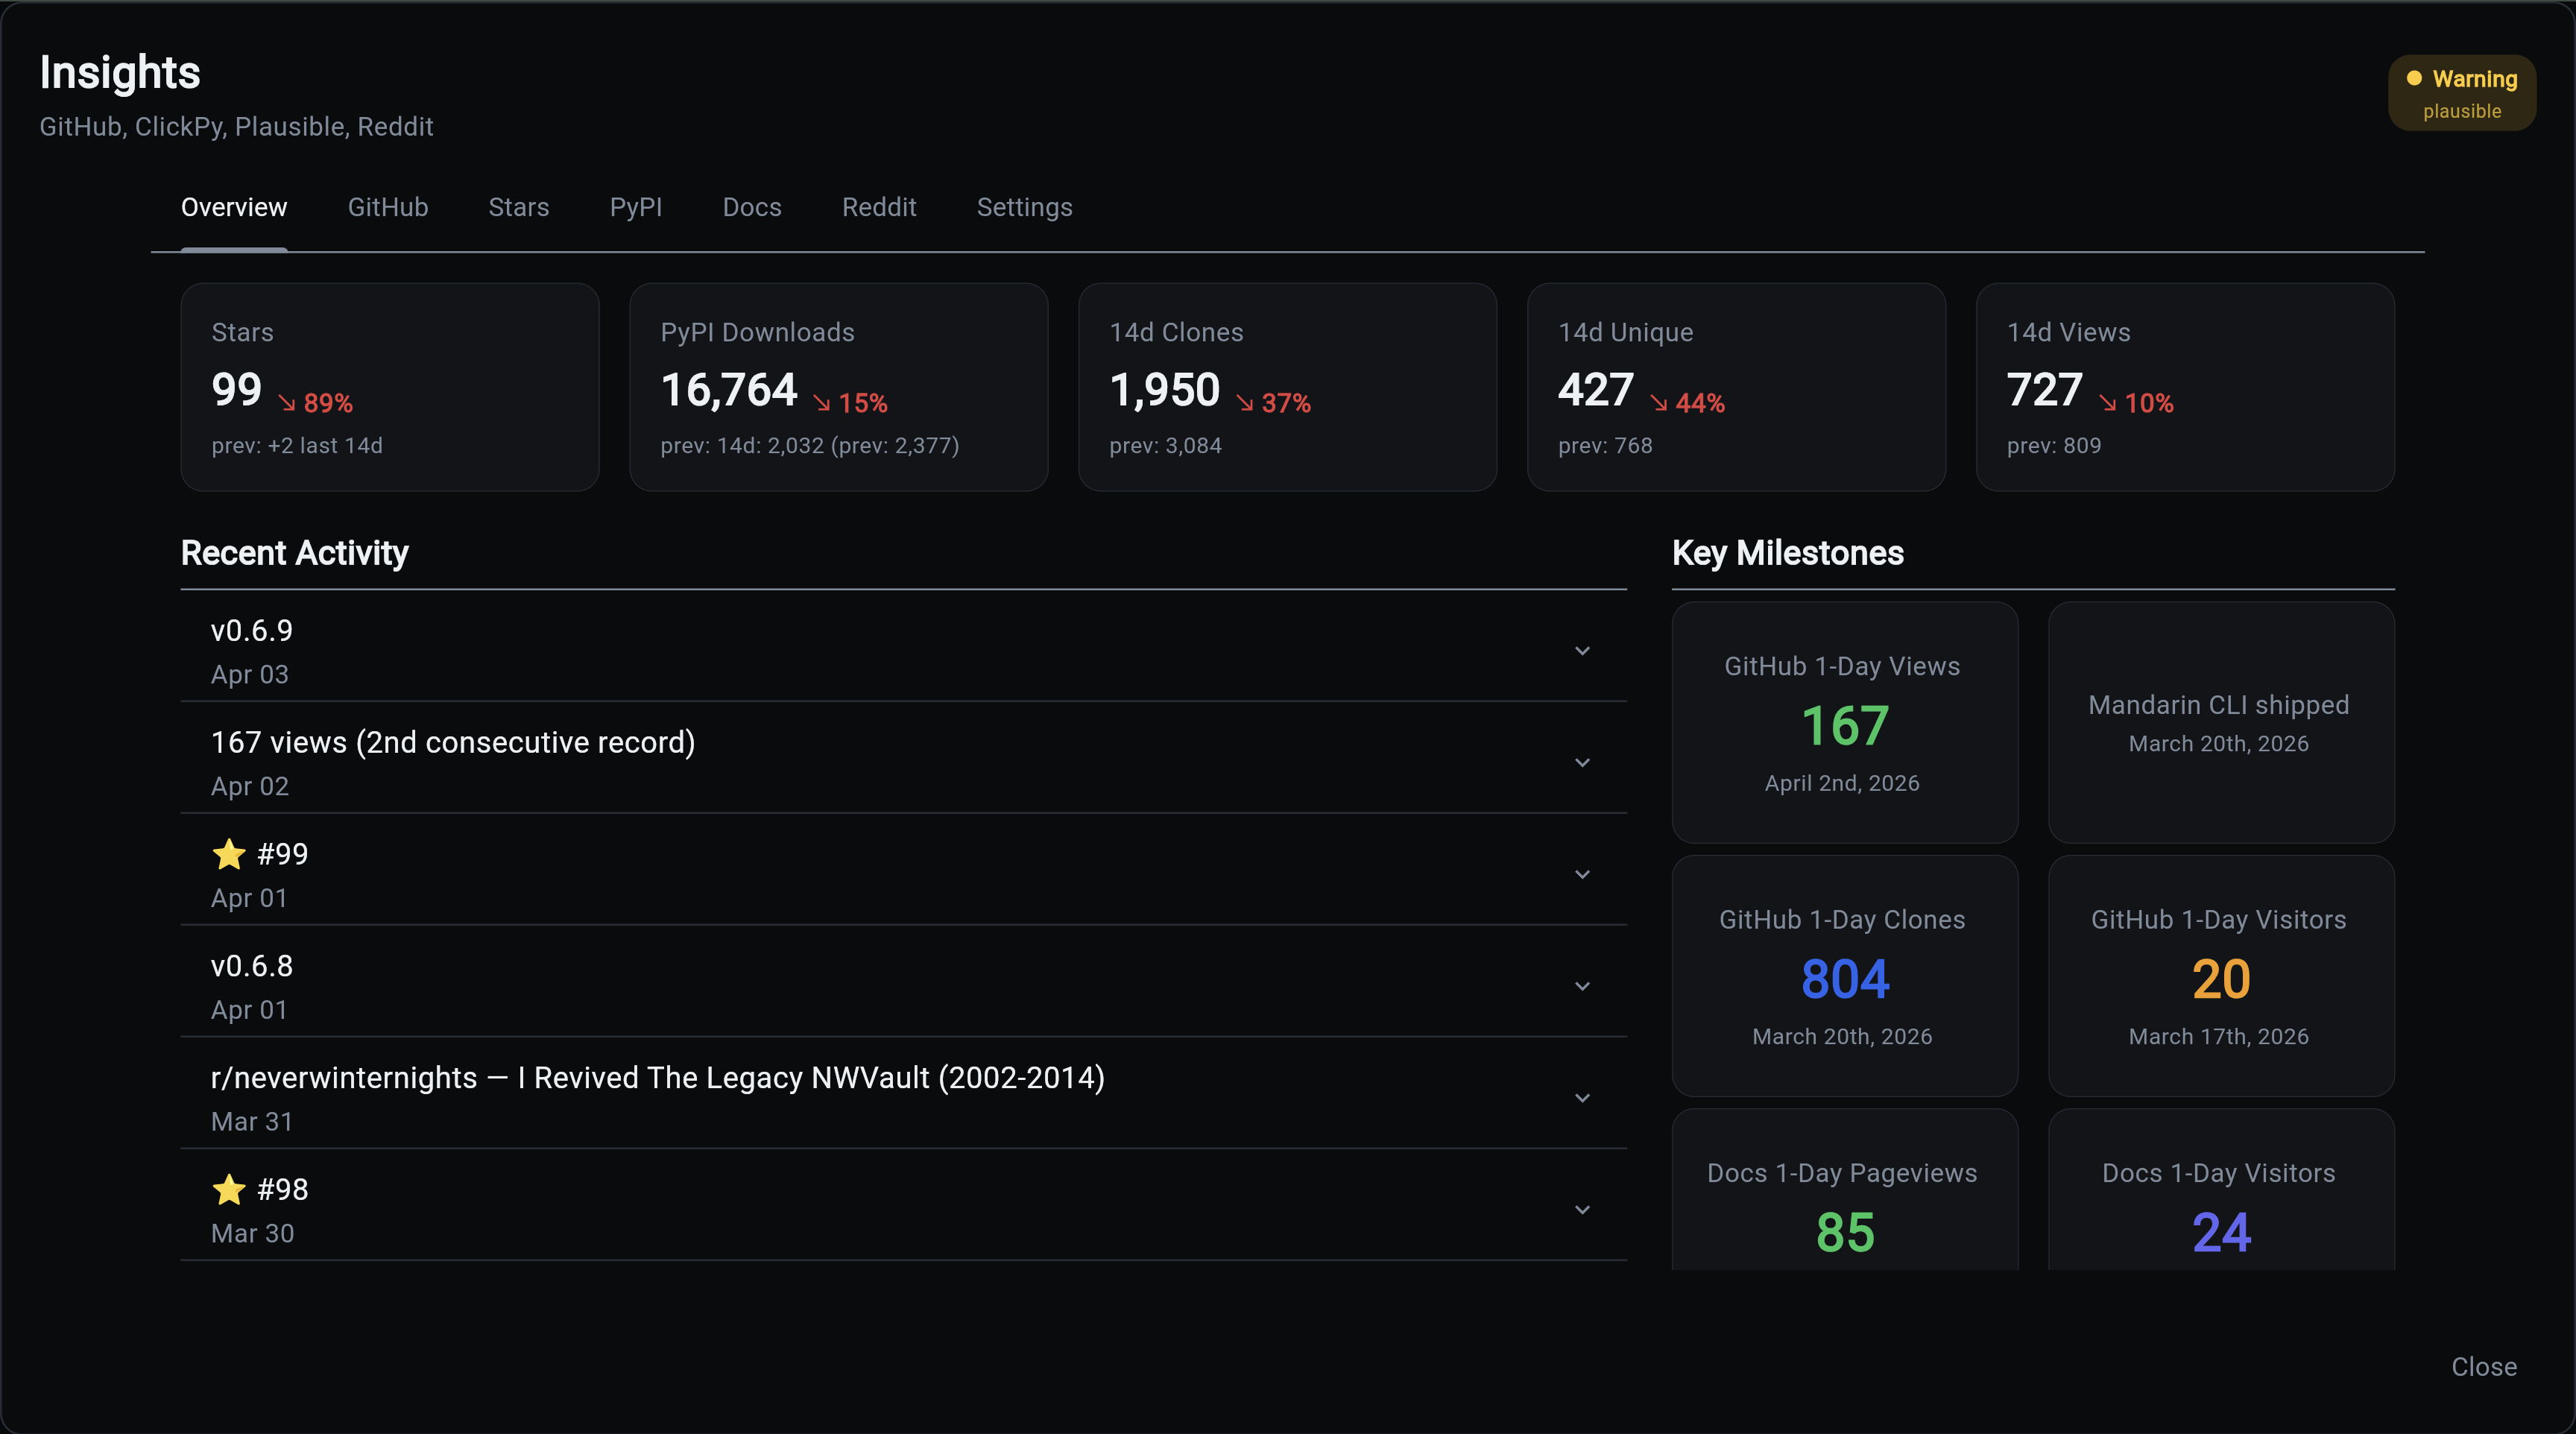
The landing tab shows a high-level summary with metric cards, a recent activity feed, and a key milestones grid.
Metric cards show period-over-period change arrows comparing the current 14-day window against the previous 14 days. Each card also shows the latest day's value (e.g., "+77 yesterday") for at-a-glance daily monitoring.
The milestones grid shows all-time records for each tracked category, including Stars Best Day and Stars Best Month. Only the highest value per category is displayed.
The activity feed uses the same expandable row pattern as the main Overseer activity panel. Expanding a release shows a link to the GitHub release page. Expanding a fork shows a link to the user's GitHub profile. Expanding a Reddit post shows upvotes, comments, and a link to the post.
GitHub Tab
Interactive GitHub Traffic with full clone/view history going back as far as data has been collected.
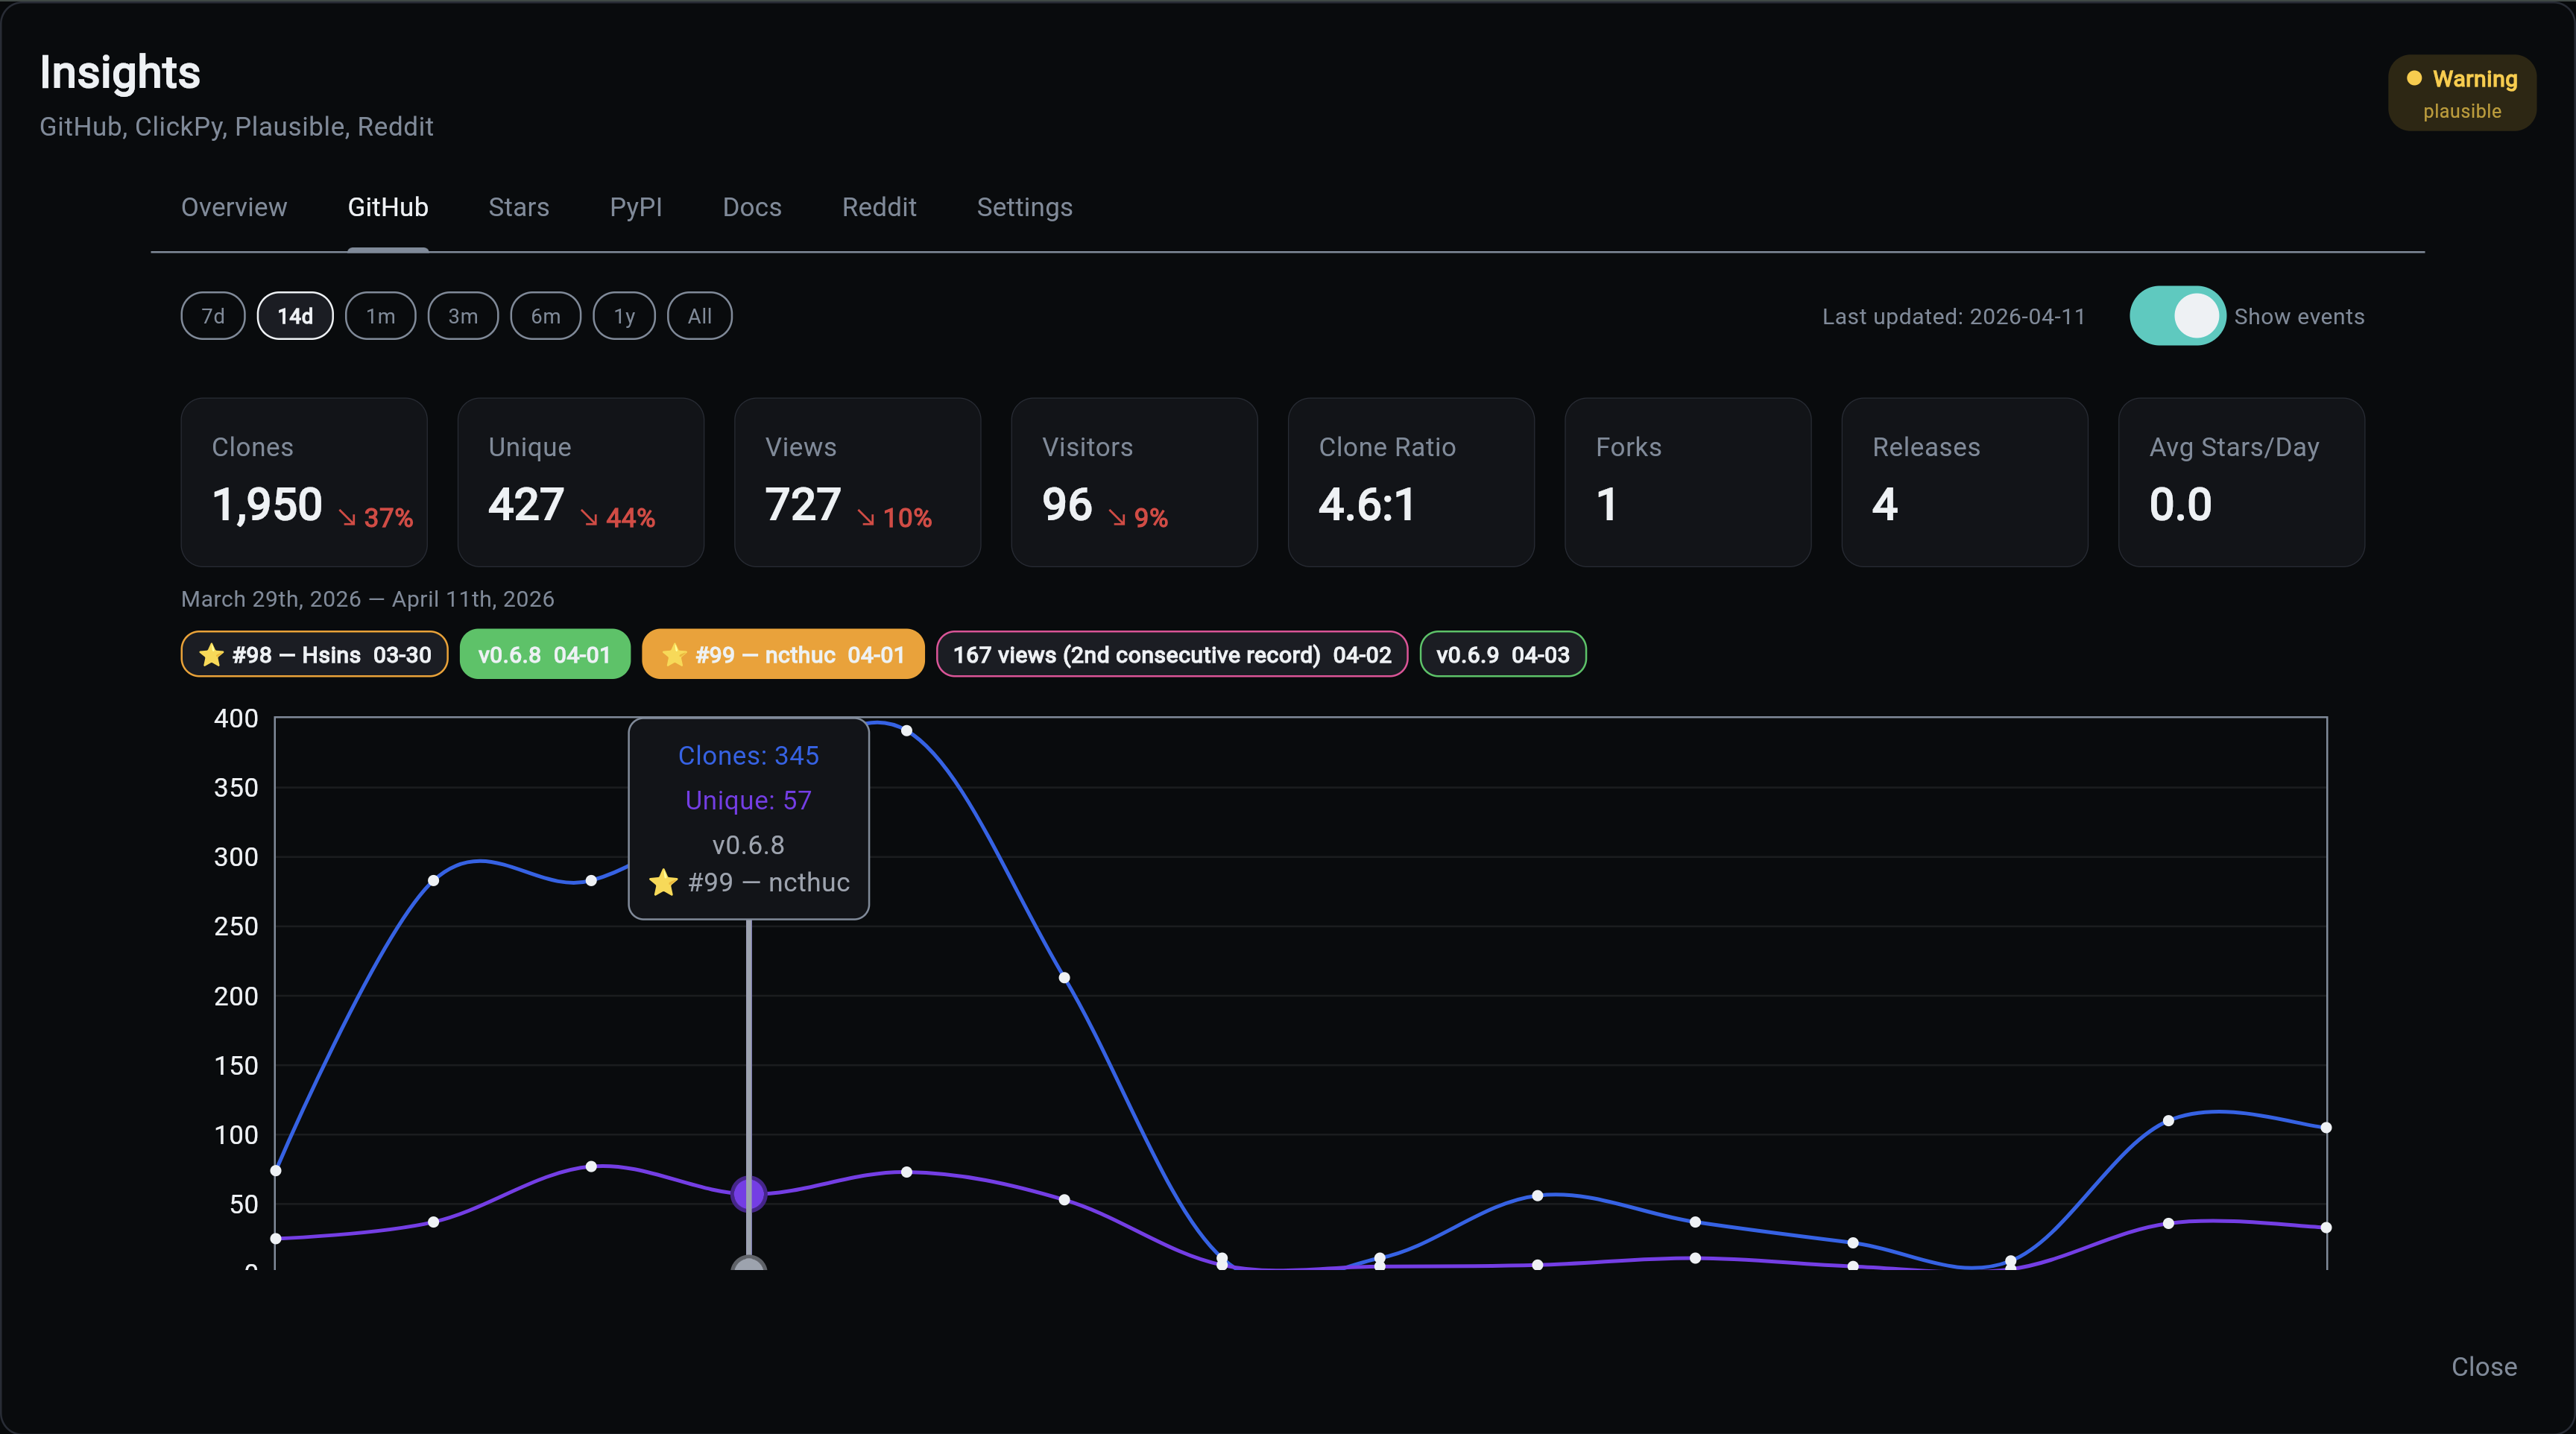
Full clone/view history going back as far as data has been collected. GitHub only retains 14 days of traffic data, but the collector persists it daily so nothing is lost. Metric cards show the latest day's values alongside period-over-period trends. Clones and views charts trim independently so neither shows dead space. Event chips are clickable and highlight the corresponding data point on the chart. Fork data comes from the GitHub API for completeness (ClickHouse misses some).
Stars Tab
Cumulative star history chart showing growth over time.
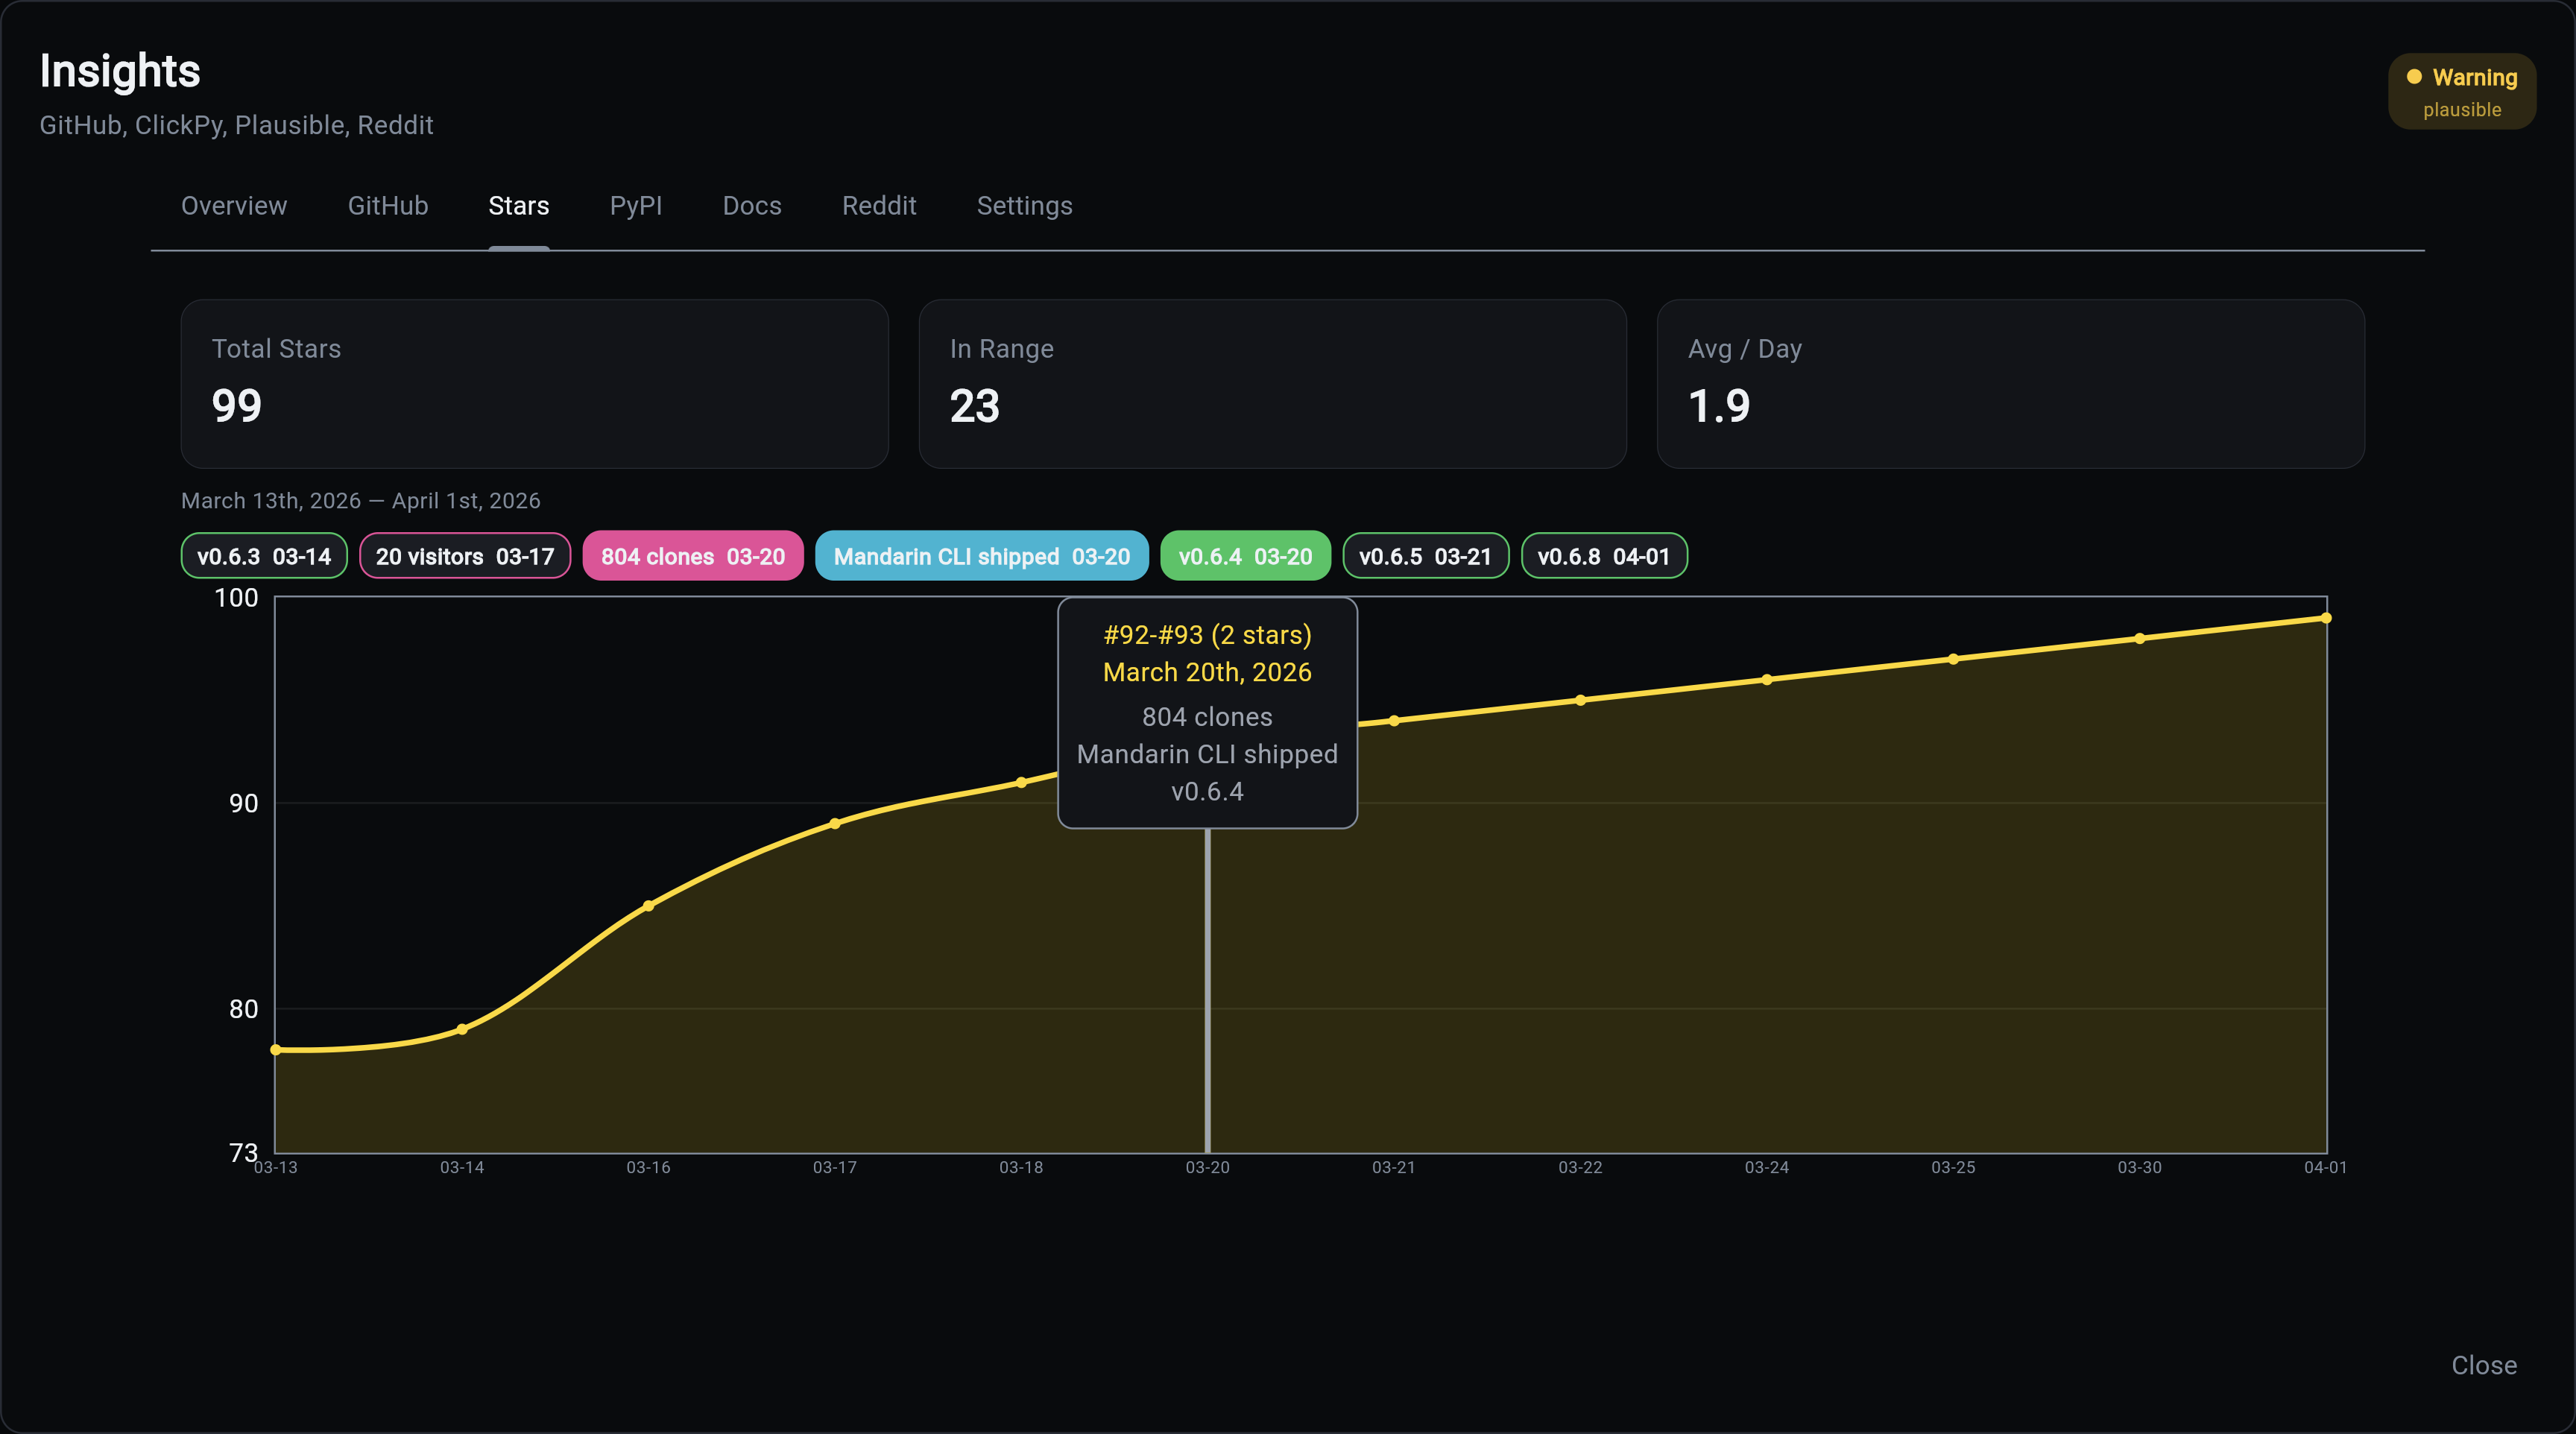
Cumulative star history with one data point per day that had activity. The Y-axis scales dynamically at zoomed ranges, and event chips only appear on dates with star activity. Tooltips show star numbers, usernames, and any events that occurred on that date.
PyPI Tab
Download analytics with human vs bot separation.
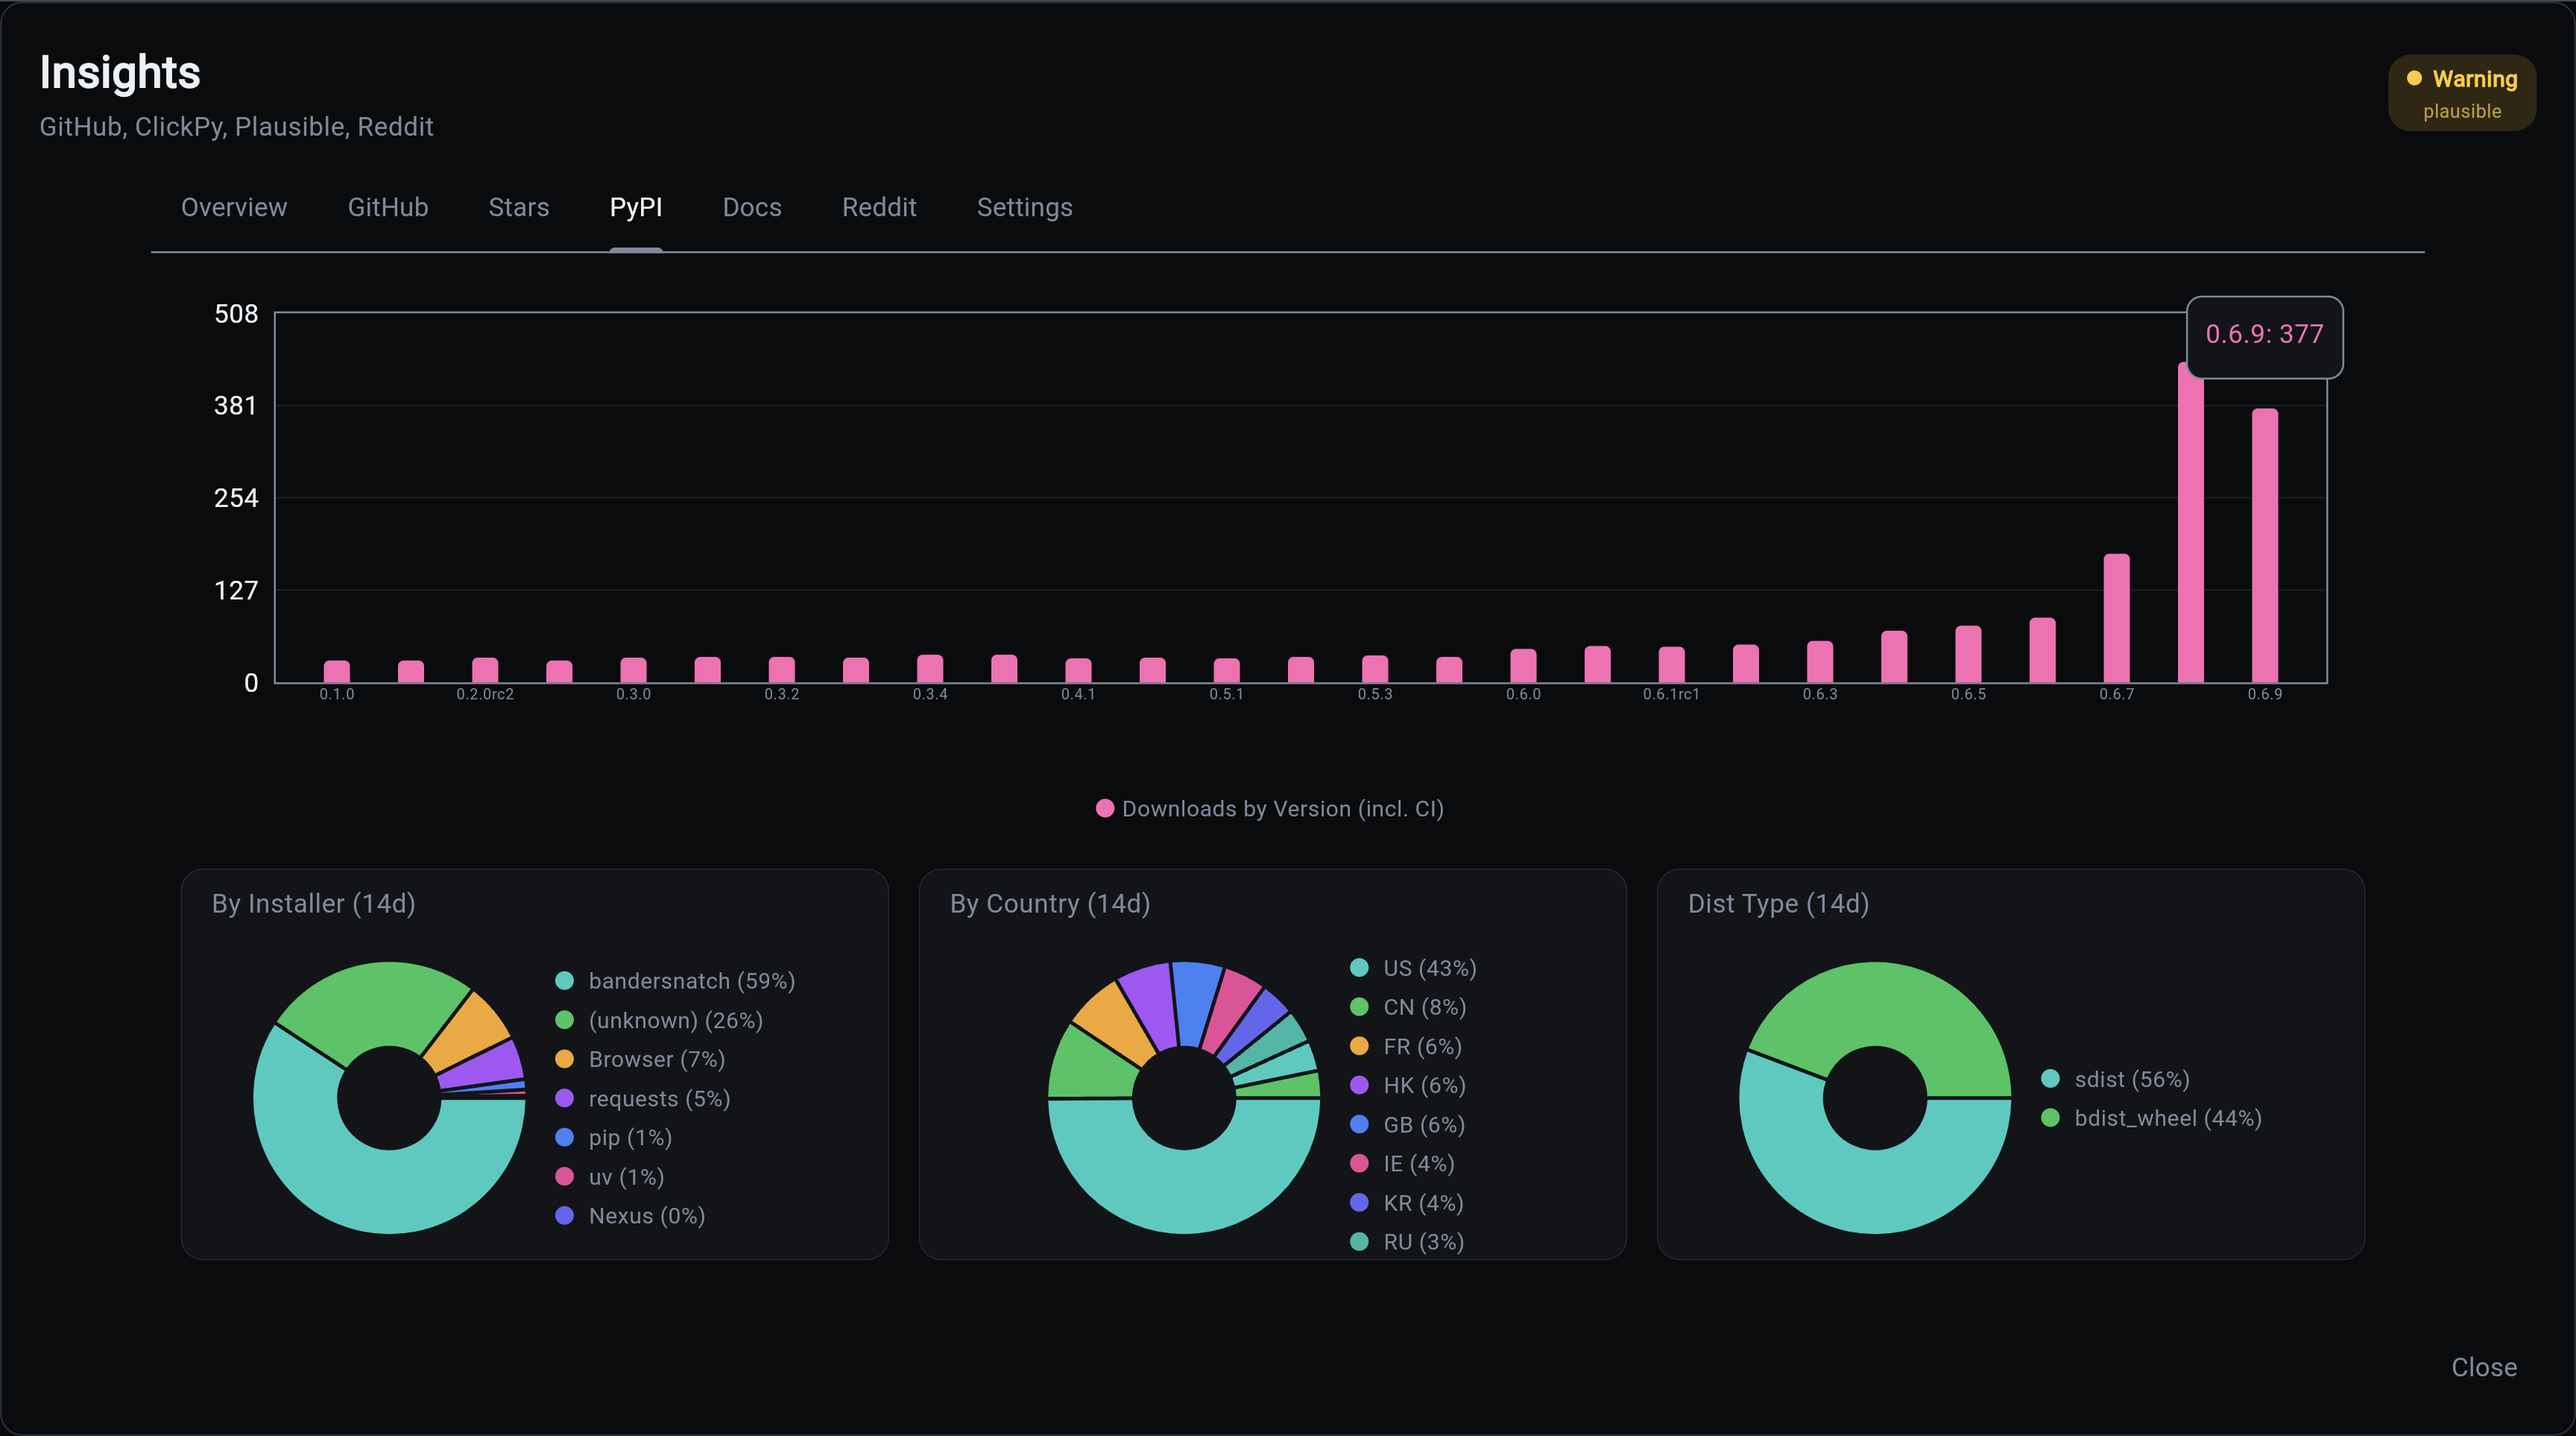
Download analytics with human vs bot separation. The CI/Mirror toggle switches between total downloads and human-only (pip + uv). Metric cards show the latest day's downloads alongside period-over-period trends. Donut charts break down downloads by installer, country, and distribution type.
Docs Tab (Plausible)
Documentation site analytics from Plausible.
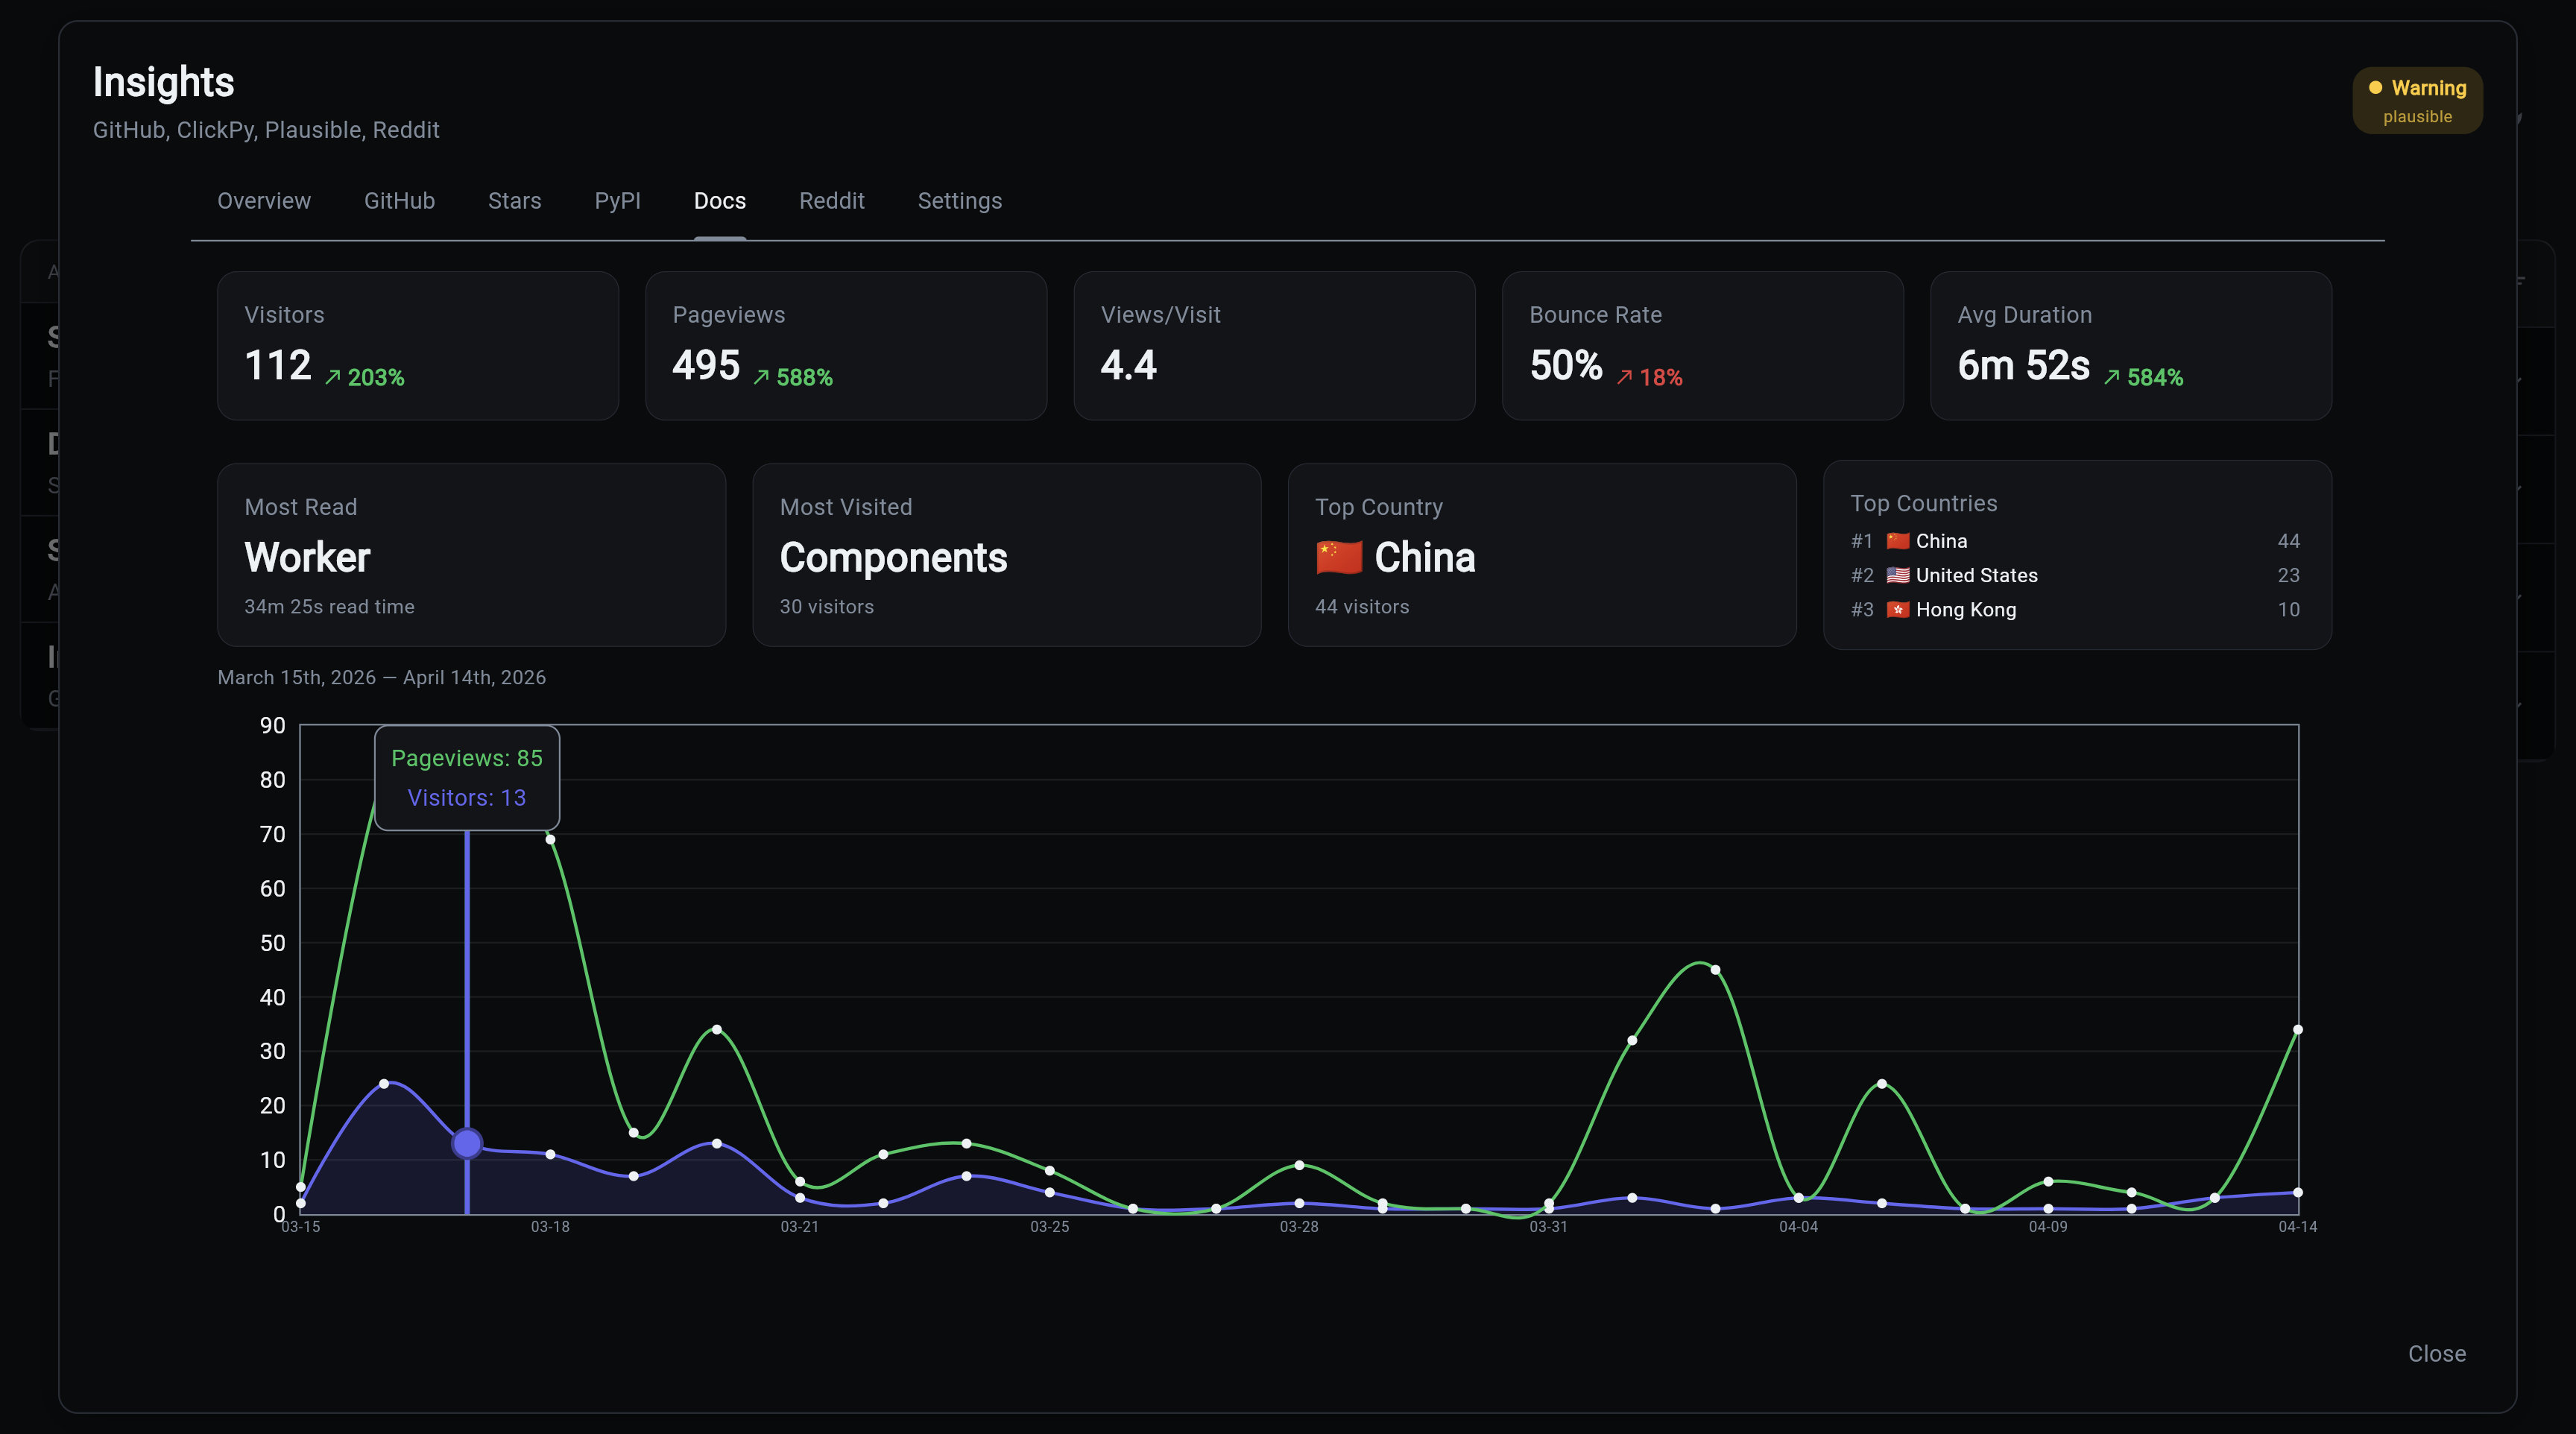
Documentation site analytics from Plausible. Insight cards surface the most-read page, most-visited page, and top countries with flag emojis. The bounce rate arrow inverts (green when it decreases). All data is range-aware and updates with date selection.
Reddit Tab
Tracked Reddit post performance. Each post shows subreddit, title, upvotes, comments, upvote ratio, and a clickable link.
Posts are added on-demand via the CLI:
Settings Tab
Data source status and configuration. Shows each source with Active/Stale/Disabled status and last collection timestamp.
API
The dashboard loads all data via a single API call:
Returns a BulkInsightsResponse containing all daily metrics, event metrics, timeline events, sources, and latest snapshots. The response is server-side cached with automatic invalidation when collectors run.
The dashboard makes zero direct database queries. All data flows through the API.
Shared Controls
All interactive tabs share a common base:
- Date range chips - 7d, 14d, 1m, 3m, 6m, 1y, All
- Events toggle - Show/hide event annotation chips
- Event grouping - At wider ranges, same-type events are grouped (weekly at 3m, monthly at 6m+)
- Date highlighting - Click an event chip to highlight all chart points in that date range
- Last updated - Shows the most recent data point date