Performance Middleware
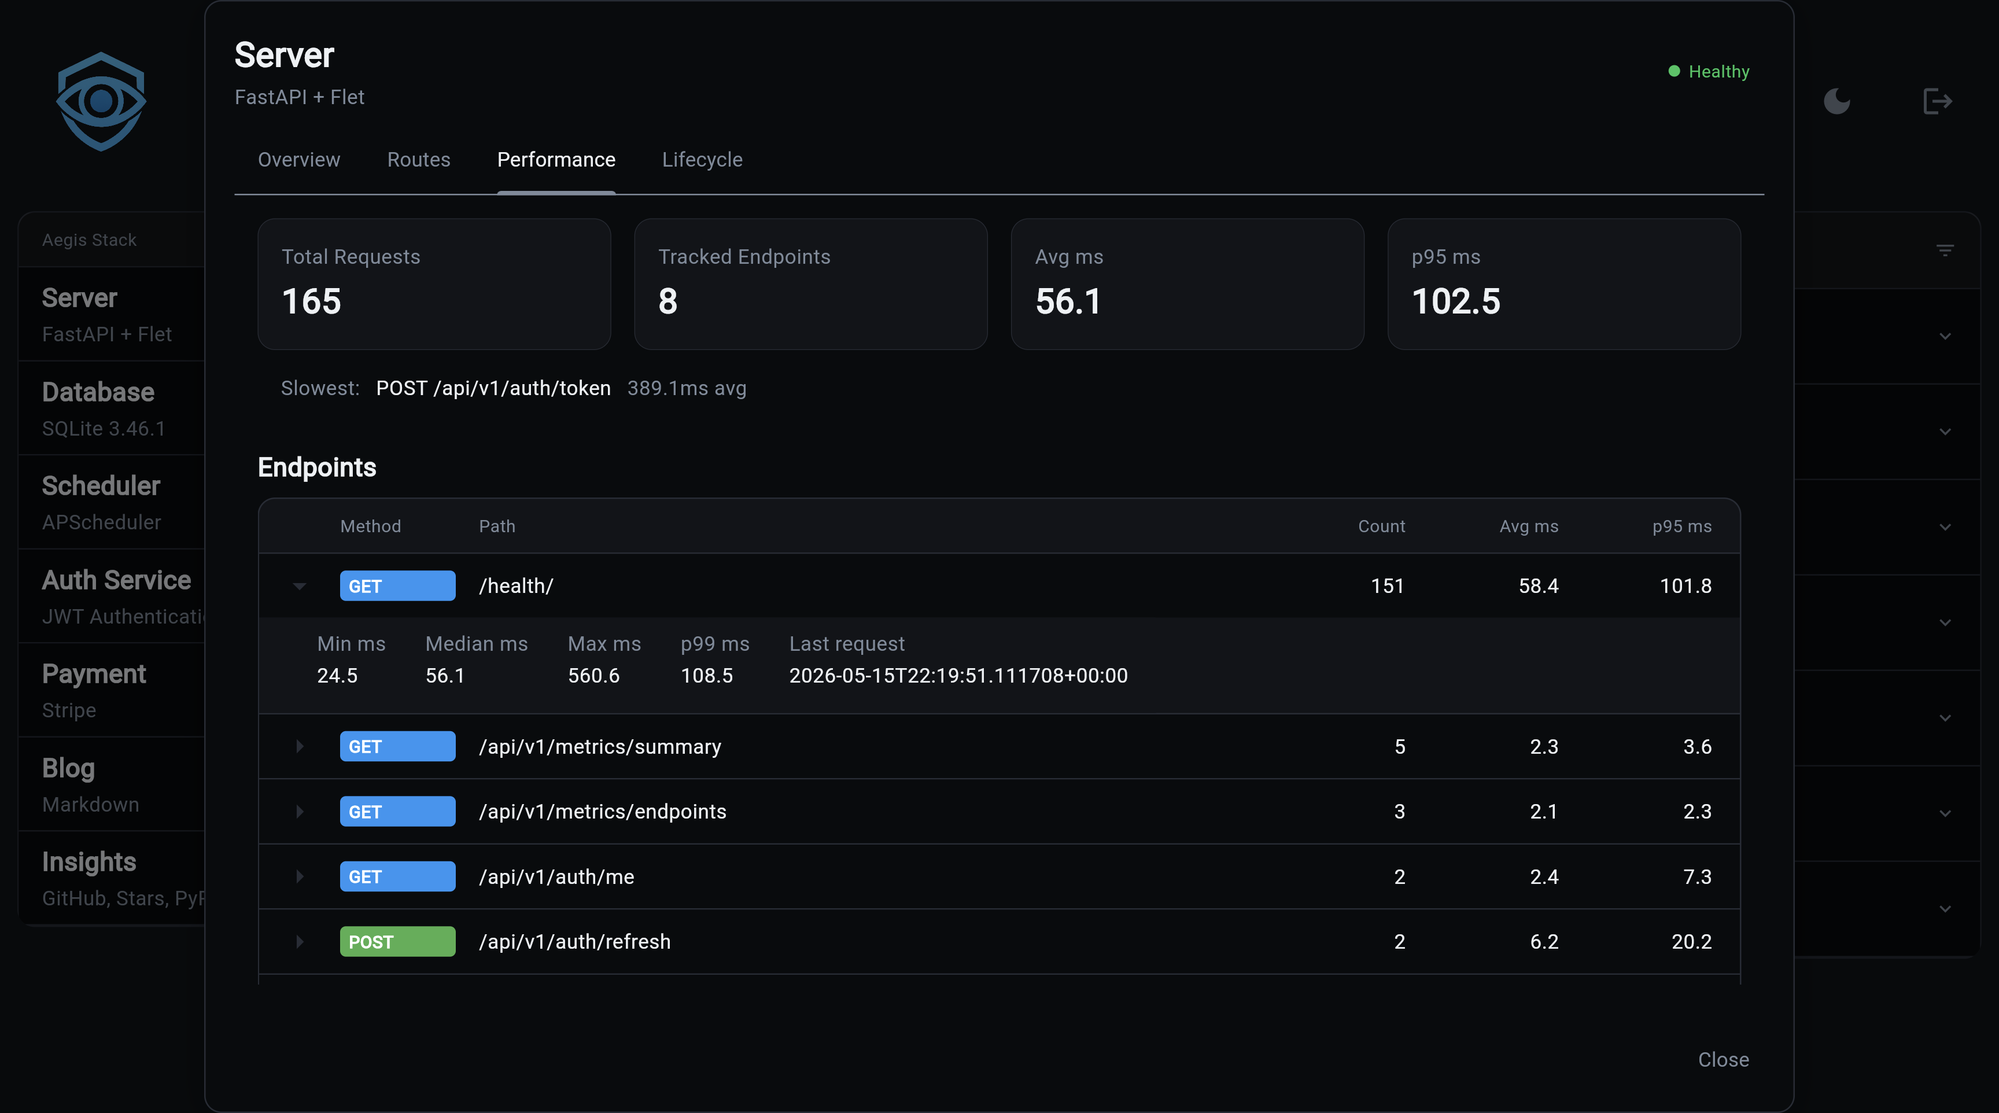
Every Aegis project ships with built-in request timing. You don't have to enable it, configure it, or stand anything up. Open the Server card on the dashboard, click the Performance tab, and you see live per-endpoint stats for your running backend.
It is meant for live debugging of the current process. There is no database, no Redis, no external collector. Stats live in the process and reset when the backend restarts. For durable, cross-process telemetry, add the observability component (Logfire, OTEL); this is the always-on view that does not need it.
What You Get
Every HTTP request is timed and bucketed by its route pattern
(/users/{id}, not /users/123), so many real requests collapse
into one row. For each endpoint you see:
- Request count
- Average, min, max response time
- Median, p95, p99 response time
- Time of the most recent request
Plus a cross-endpoint roll-up: total requests, slowest endpoint, global average and p95.
Every response also carries an X-Response-Time header in
milliseconds, so the same data is available to clients without
opening the dashboard.
Where You See It
Performance Tab
Dashboard, Server card, Performance tab. The tab fetches the latest numbers on every open and renders an expandable table sorted by call count. Click a row to see the full distribution.
A fresh process with no traffic yet shows an empty-state message rather than a zero-row table.
Metrics API
| Endpoint | Returns |
|---|---|
GET /api/v1/metrics/summary |
Cross-endpoint roll-up |
GET /api/v1/metrics/endpoints |
Per-endpoint detail, keyed by "<METHOD> <pattern>" |
Both are auth-gated when the auth service is included, and open otherwise.
Caveats
One counter per worker
Under multiple worker processes (gunicorn -w 4,
uvicorn --workers 4), each worker keeps its own independent
counter. The modal shows whichever worker happened to handle
your request, and successive opens can disagree. For aggregated
cross-worker telemetry, route through the observability
component instead.
Resets on restart
No persistence. Restart the backend and every count drops to zero. This is intentional: the goal is "what's slow right now," not historical trend analysis. If you want history, use observability.
Percentiles Are A Recent Window
Counts, averages, min, and max are all-time over the current process. Percentiles (median, p95, p99) are computed over the most recent 100 samples per endpoint, which keeps the math cheap and the memory bounded. The trade-off: percentiles track recent behavior rather than the whole lifetime, so a deploy that slowed down an hour ago stops showing in p95 once 100 newer requests have landed.
This is usually what you want when you're looking at "is the app slow right now."
When To Reach For Observability Instead
This middleware is great at: live debugging, cheap percentiles per endpoint, sanity-checking a deploy, finding the obviously slow route. It is not a replacement for proper observability, and is bad at: anything that needs history, anything that needs to aggregate across worker processes, anything that needs alerting, anything involving traces or downstream calls.
Add observability when you outgrow the in-process view. The two coexist; you don't have to pick.